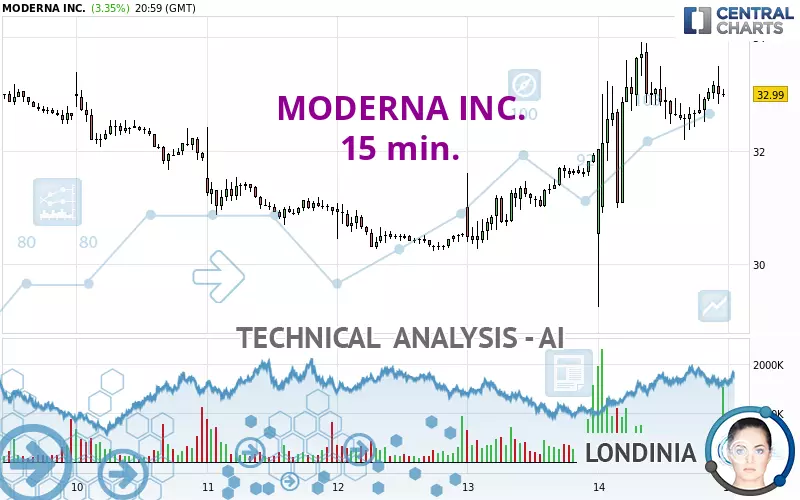
MODERNA INC. - 15 min. - Technical analysis published on 02/15/2025 (GMT)
- 116
- 0
Click here for a new analysis!
- Timeframe : 15 min.
- - Analysis generated on
- Status : TARGET REACHED
Summary of the analysis

Additional analysis
Quotes
MODERNA INC. rating 32.99 USD. The price has increased by +3.35% since the last closing and was traded between 29.25 USD and 33.91 USD over the period. The price is currently at +12.79% from its lowest and -2.71% from its highest.A bearish opening was detected by the Central Gaps scanner. Sellers are trying to impose a bearish trend in the very short term.
Bearish opening
Type : Bearish
Timeframe : Openning
A study of price movements over other periods shows the following variations:
New LOW record (5 years)
Type : Bearish
Timeframe : Weekly
New LOW record (1 year)
Type : Bearish
Timeframe : Weekly
New LOW record (1st january)
Type : Bearish
Timeframe : Weekly
New LOW record (1 month)
Type : Bearish
Timeframe : Weekly
Abnormal volumes on MODERNA INC. were detected by the Central Volumes scanner:
Abnormal volumes
Timeframe : 5 days
Abnormal volumes
Timeframe : 20 days
Abnormal volumes
Timeframe : 50 days
Technical
A technical analysis in 15 min. of this MODERNA INC. chart shows a strongly bullish trend. 89.29% of the signals given by moving averages are bullish. The slightly bullish signals given by the short-term moving averages indicate this trend is showing signs of running out of steam. There is no crossing of moving average by the price or crossing of moving averages between themselves.
In fact, only 8 technical indicators out of 18 studied are currently positioned bullish. Caution: the Central Indicators scanner currently detects an excess:
MACD indicator: bearish divergence
Type : Bearish
Timeframe : 15 minutes
RSI indicator: bearish divergence
Type : Bearish
Timeframe : 15 minutes
Pivot points : price is over resistance 1
Type : Neutral
Timeframe : 15 minutes
Central Patterns, the scanner specializing in chart patterns, did not identify any signals.
For a small setback in the very short term, the Central Candlesticks scanner currently notes the presence of this bearish pattern in Japanese candlesticks:
Bearish harami
Type : Bearish
Timeframe : 15 minutes
| S2 | S1 | Price | R1 | R2 | R3 | |
|---|---|---|---|---|---|---|
| ProTrendLines | 29.25 | 31.94 | 32.99 | 33.88 | 41.09 | 45.05 |
| Change (%) | -11.34% | -3.18% | - | +2.70% | +24.55% | +36.56% |
| Change | -3.74 | -1.05 | - | +0.89 | +8.10 | +12.06 |
| Level | Minor | Intermediate | - | Intermediate | Minor | Major |
Pivot points can also be used to set your price objectives. Here is the price situation in relation to pivot points:
| Pivot points | S3 | S2 | S1 | PP | R1 | R2 | R3 |
|---|---|---|---|---|---|---|---|
| Standard | 25.53 | 27.39 | 30.19 | 32.05 | 34.85 | 36.71 | 39.51 |
| Camarilla | 31.71 | 32.14 | 32.56 | 32.99 | 33.42 | 33.84 | 34.27 |
| Woodie | 26.00 | 27.63 | 30.66 | 32.29 | 35.32 | 36.95 | 39.98 |
| Fibonacci | 27.39 | 29.17 | 30.27 | 32.05 | 33.83 | 34.93 | 36.71 |
| Pivot points | S3 | S2 | S1 | PP | R1 | R2 | R3 |
|---|---|---|---|---|---|---|---|
| Standard | 14.29 | 23.11 | 31.27 | 40.09 | 48.25 | 57.07 | 65.23 |
| Camarilla | 34.75 | 36.31 | 37.86 | 39.42 | 40.98 | 42.53 | 44.09 |
| Woodie | 13.95 | 22.95 | 30.93 | 39.93 | 47.91 | 56.91 | 64.89 |
| Fibonacci | 23.11 | 29.60 | 33.61 | 40.09 | 46.58 | 50.59 | 57.07 |
Numerical data
The following is the status of the technical indicators and moving averages at the time of publication of this technical analysis:
| RSI (14): | 55.19 | |
| MACD (12,26,9): | 0.2300 | |
| Directional Movement: | 5.28 | |
| AROON (14): | -35.71 | |
| DEMA (21): | 33.08 | |
| Parabolic SAR (0,02-0,02-0,2): | 32.50 | |
| Elder Ray (13): | 0.30 | |
| Super Trend (3,10): | 31.57 | |
| Zig ZAG (10): | 32.99 | |
| VORTEX (21): | 1.1500 | |
| Stochastique (14,3,5): | 66.68 | |
| TEMA (21): | 33.00 | |
| Williams %R (14): | -38.16 | |
| Chande Momentum Oscillator (20): | 0.27 | |
| Repulse (5,40,3): | -0.0500 | |
| ROCnROLL: | 1 | |
| TRIX (15,9): | 0.1200 | |
| Courbe Coppock: | 0.91 |
| MA7: | 32.06 | |
| MA20: | 36.51 | |
| MA50: | 39.11 | |
| MA100: | 45.75 | |
| MAexp7: | 32.93 | |
| MAexp20: | 32.74 | |
| MAexp50: | 32.23 | |
| MAexp100: | 32.03 | |
| Price / MA7: | +2.90% | |
| Price / MA20: | -9.64% | |
| Price / MA50: | -15.65% | |
| Price / MA100: | -27.89% | |
| Price / MAexp7: | +0.18% | |
| Price / MAexp20: | +0.76% | |
| Price / MAexp50: | +2.36% | |
| Price / MAexp100: | +3.00% |
News
The last news published on MODERNA INC. at the time of the generation of this analysis was as follows:
- Moderna Reports Fourth Quarter and Fiscal Year 2024 Financial Results and Provides Business Updates
- Moderna to Report Fourth Quarter and Full Year 2024 Financial Results on Friday, February 14, 2025
- Moderna Awarded Tender for the Supply of Its mRNA COVID-19 Vaccine in the European Union
- Moderna Announces Updates on Pandemic Influenza Program
- Moderna Provides Business and Pipeline Updates at 43rd Annual J.P. Morgan Healthcare Conference
About author

Online


Add a comment
Comments
0 comments on the analysis MODERNA INC. - 15 min.