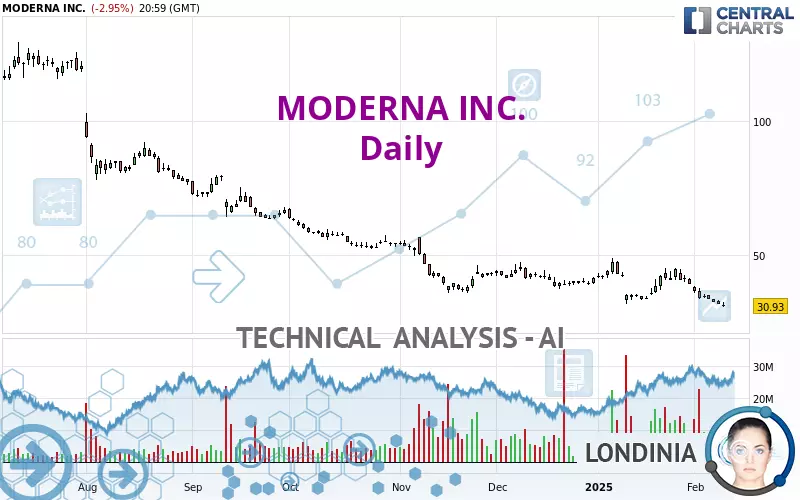
MODERNA INC. - Daily - Technical analysis published on 02/12/2025 (GMT)
- 101
- 0
Click here for a new analysis!
- Timeframe : Daily
- - Analysis generated on
- Status : INVALID

Summary of the analysis

Additional analysis
Quotes
The MODERNA INC. price is 30.93 USD. On the day, this instrument lost -2.95% and was between 30.70 USD and 32.42 USD. This implies that the price is at +0.75% from its lowest and at -4.60% from its highest.The Central Gaps scanner detects a bearish gap which is a sign that the sellers have taken the lead in the very short term.
Opening Gap DOWN
Type : Bearish
Timeframe : Openning
A study of price movements over other periods shows the following variations:
New LOW record (5 years)
Type : Bearish
Timeframe : Weekly
New LOW record (1 year)
Type : Bearish
Timeframe : Weekly
New LOW record (1st january)
Type : Bearish
Timeframe : Weekly
New LOW record (1 month)
Type : Bearish
Timeframe : Weekly
The Central Volumes scanner notes the presence of abnormal volumes:
Abnormal volumes
Timeframe : 20 days
Technical
Technical analysis of this Daily chart of MODERNA INC. indicates that the overall trend is strongly bearish. 92.86% of the signals given by moving averages are bearish. This strongly bearish trend is supported by the strong bearish signals given by short-term moving averages. The Central Indicators scanner does not detect any result on moving averages that would impact this trend.
In fact, 10 technical indicators on 18 studied are currently positioned bearish. But beware of excesses. The Central Indicators scanner currently detects this:
CCI indicator is oversold : under -100
Type : Neutral
Timeframe : Daily
Williams %R indicator is oversold : under -80
Type : Neutral
Timeframe : Daily
Pivot points : price is under support 1
Type : Neutral
Timeframe : Daily
No signals are given by Central Patterns, a market scanner specialised in chart patterns, resistances and supports.
The Central Candlesticks scanner, specialised in Japanese candlesticks, did not identify any signals.
| Price | R1 | R2 | R3 | |
|---|---|---|---|---|
| ProTrendLines | 30.93 | 45.11 | 80.10 | 116.47 |
| Change (%) | - | +45.85% | +158.97% | +276.56% |
| Change | - | +14.18 | +49.17 | +85.54 |
| Level | - | Intermediate | Minor | Major |
To determine price objectives, it is also possible to use the pivot points. Here is the price position in relation to pivot points:
| Pivot points | S3 | S2 | S1 | PP | R1 | R2 | R3 |
|---|---|---|---|---|---|---|---|
| Standard | 28.56 | 29.63 | 30.28 | 31.35 | 32.00 | 33.07 | 33.72 |
| Camarilla | 30.46 | 30.62 | 30.77 | 30.93 | 31.09 | 31.25 | 31.40 |
| Woodie | 28.35 | 29.53 | 30.07 | 31.25 | 31.79 | 32.97 | 33.51 |
| Fibonacci | 29.63 | 30.29 | 30.69 | 31.35 | 32.01 | 32.41 | 33.07 |
| Pivot points | S3 | S2 | S1 | PP | R1 | R2 | R3 |
|---|---|---|---|---|---|---|---|
| Standard | 24.30 | 28.38 | 30.49 | 34.57 | 36.68 | 40.76 | 42.87 |
| Camarilla | 30.90 | 31.47 | 32.03 | 32.60 | 33.17 | 33.74 | 34.30 |
| Woodie | 23.32 | 27.89 | 29.51 | 34.08 | 35.70 | 40.27 | 41.89 |
| Fibonacci | 28.38 | 30.75 | 32.21 | 34.57 | 36.94 | 38.40 | 40.76 |
| Pivot points | S3 | S2 | S1 | PP | R1 | R2 | R3 |
|---|---|---|---|---|---|---|---|
| Standard | 14.29 | 23.11 | 31.27 | 40.09 | 48.25 | 57.07 | 65.23 |
| Camarilla | 34.75 | 36.31 | 37.86 | 39.42 | 40.98 | 42.53 | 44.09 |
| Woodie | 13.95 | 22.95 | 30.93 | 39.93 | 47.91 | 56.91 | 64.89 |
| Fibonacci | 23.11 | 29.60 | 33.61 | 40.09 | 46.58 | 50.59 | 57.07 |
Numerical data
The following is the status of the technical indicators and moving averages at the time of publication of this technical analysis:
| RSI (14): | 34.26 | |
| MACD (12,26,9): | -2.1800 | |
| Directional Movement: | -11.06 | |
| AROON (14): | -85.71 | |
| DEMA (21): | 34.11 | |
| Parabolic SAR (0,02-0,02-0,2): | 43.03 | |
| Elder Ray (13): | -3.89 | |
| Super Trend (3,10): | 39.73 | |
| Zig ZAG (10): | 30.93 | |
| VORTEX (21): | 0.9100 | |
| Stochastique (14,3,5): | 1.39 | |
| TEMA (21): | 33.16 | |
| Williams %R (14): | -98.44 | |
| Chande Momentum Oscillator (20): | -10.48 | |
| Repulse (5,40,3): | -13.1400 | |
| ROCnROLL: | 2 | |
| TRIX (15,9): | -0.4500 | |
| Courbe Coppock: | 17.97 |
| MA7: | 33.53 | |
| MA20: | 36.89 | |
| MA50: | 39.82 | |
| MA100: | 46.83 | |
| MAexp7: | 33.67 | |
| MAexp20: | 36.64 | |
| MAexp50: | 40.59 | |
| MAexp100: | 50.06 | |
| Price / MA7: | -7.75% | |
| Price / MA20: | -16.16% | |
| Price / MA50: | -22.33% | |
| Price / MA100: | -33.95% | |
| Price / MAexp7: | -8.14% | |
| Price / MAexp20: | -15.58% | |
| Price / MAexp50: | -23.80% | |
| Price / MAexp100: | -38.21% |
News
The last news published on MODERNA INC. at the time of the generation of this analysis was as follows:
- Moderna to Report Fourth Quarter and Full Year 2024 Financial Results on Friday, February 14, 2025
- Moderna Awarded Tender for the Supply of Its mRNA COVID-19 Vaccine in the European Union
- Moderna Announces Updates on Pandemic Influenza Program
- Moderna Provides Business and Pipeline Updates at 43rd Annual J.P. Morgan Healthcare Conference
- Moderna to Present at Upcoming Conferences in December 2024
About author

Online


Add a comment
Comments
0 comments on the analysis MODERNA INC. - Daily