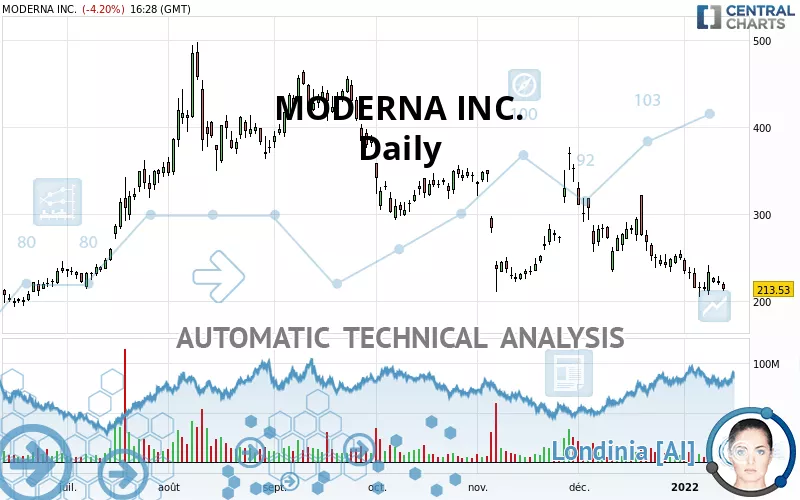
MODERNA INC. - Daily - Technical analysis published on 01/13/2022 (GMT)
- 261
- 0
Click here for a new analysis!
- Timeframe : Daily
- - Analysis generated on
- Status : TARGET REACHED

Summary of the analysis

Additional analysis
Quotes
The MODERNA INC. price is 213.52 USD. On the day, this instrument lost -4.20% with the lowest point at 211.43 USD and the highest point at 221.50 USD. The deviation from the price is +0.99% for the low point and -3.60% for the high point.The Central Gaps scanner detects a bearish opening marking the presence of sellers ahead of buyers at the opening but not sufficiently marked to allow the price to register a quotation gap.
Bearish opening
Type : Bearish
Timeframe : Openning
So that you have an overall view of the price change, here is a table showing the variations over several periods:
Near a new LOW record (1st january)
Type : Bearish
Timeframe : Weekly
Near a new LOW record (1 month)
Type : Bearish
Timeframe : Weekly
Technical
A technical analysis in Daily of this MODERNA INC. chart shows a sharp bearish trend. 92.86% of the signals given by moving averages are bearish. This strongly bearish trend is supported by the strong bearish signals given by short-term moving averages. The Central Indicators market scanner currently does not detect any result that concerns moving averages.
In fact, according to the parameters integrated into the Central Analyzer system, 10 technical indicators out of 18 analysed are currently bearish. Caution: the Central Indicators scanner currently detects an excess:
CCI indicator is oversold : under -100
Type : Neutral
Timeframe : Daily
Williams %R indicator is oversold : under -80
Type : Neutral
Timeframe : Daily
Pivot points : price is under support 2
Type : Neutral
Timeframe : Daily
No signals are given by Central Patterns, a market scanner specialised in chart patterns, resistances and supports.
The Central Candlesticks scanner which studies Japanese candlesticks did not detect anything.
| S3 | S2 | S1 | Price | R1 | R2 | R3 | |
|---|---|---|---|---|---|---|---|
| ProTrendLines | 118.49 | 149.87 | 185.99 | 213.52 | 225.82 | 254.60 | 302.42 |
| Change (%) | -44.51% | -29.81% | -12.89% | - | +5.76% | +19.24% | +41.64% |
| Change | -95.03 | -63.65 | -27.53 | - | +12.30 | +41.08 | +88.90 |
| Level | Minor | Minor | Major | - | Major | Intermediate | Intermediate |
Pivot points can also be used to set your price objectives. Here is the price situation in relation to pivot points:
| Pivot points | S3 | S2 | S1 | PP | R1 | R2 | R3 |
|---|---|---|---|---|---|---|---|
| Standard | 208.53 | 213.64 | 218.27 | 223.38 | 228.01 | 233.12 | 237.75 |
| Camarilla | 220.21 | 221.10 | 222.00 | 222.89 | 223.78 | 224.68 | 225.57 |
| Woodie | 208.28 | 213.52 | 218.02 | 223.26 | 227.76 | 233.00 | 237.50 |
| Fibonacci | 213.64 | 217.36 | 219.66 | 223.38 | 227.10 | 229.40 | 233.12 |
| Pivot points | S3 | S2 | S1 | PP | R1 | R2 | R3 |
|---|---|---|---|---|---|---|---|
| Standard | 152.06 | 178.65 | 196.25 | 222.84 | 240.44 | 267.03 | 284.63 |
| Camarilla | 201.71 | 205.76 | 209.81 | 213.86 | 217.91 | 221.96 | 226.01 |
| Woodie | 147.58 | 176.40 | 191.77 | 220.59 | 235.96 | 264.78 | 280.15 |
| Fibonacci | 178.65 | 195.53 | 205.96 | 222.84 | 239.72 | 250.15 | 267.03 |
| Pivot points | S3 | S2 | S1 | PP | R1 | R2 | R3 |
|---|---|---|---|---|---|---|---|
| Standard | 109.51 | 171.35 | 212.67 | 274.51 | 315.83 | 377.67 | 418.99 |
| Camarilla | 225.61 | 235.07 | 244.52 | 253.98 | 263.44 | 272.89 | 282.35 |
| Woodie | 99.24 | 166.22 | 202.40 | 269.38 | 305.56 | 372.54 | 408.72 |
| Fibonacci | 171.35 | 210.76 | 235.11 | 274.51 | 313.92 | 338.27 | 377.67 |
Numerical data
The following is the status of the technical indicators and moving averages at the time of publication of this technical analysis:
| RSI (14): | 36.82 | |
| MACD (12,26,9): | -16.4700 | |
| Directional Movement: | -8.68 | |
| AROON (14): | -28.58 | |
| DEMA (21): | 218.50 | |
| Parabolic SAR (0,02-0,02-0,2): | 259.58 | |
| Elder Ray (13): | -14.52 | |
| Super Trend (3,10): | 270.71 | |
| Zig ZAG (10): | 212.91 | |
| VORTEX (21): | 0.8500 | |
| Stochastique (14,3,5): | 24.65 | |
| TEMA (21): | 213.50 | |
| Williams %R (14): | -85.33 | |
| Chande Momentum Oscillator (20): | -27.73 | |
| Repulse (5,40,3): | -3.1100 | |
| ROCnROLL: | 2 | |
| TRIX (15,9): | -0.8000 | |
| Courbe Coppock: | 30.41 |
| MA7: | 219.52 | |
| MA20: | 243.49 | |
| MA50: | 262.51 | |
| MA100: | 319.02 | |
| MAexp7: | 222.95 | |
| MAexp20: | 239.86 | |
| MAexp50: | 266.88 | |
| MAexp100: | 284.39 | |
| Price / MA7: | -2.73% | |
| Price / MA20: | -12.31% | |
| Price / MA50: | -18.66% | |
| Price / MA100: | -33.07% | |
| Price / MAexp7: | -4.23% | |
| Price / MAexp20: | -10.98% | |
| Price / MAexp50: | -19.99% | |
| Price / MAexp100: | -24.92% |
News
The latest news and videos published on MODERNA INC. at the time of the analysis were as follows:
- Moderna Announces Advances Across Its Industry-Leading mRNA Pipeline and Provides Business Update
- Moderna and Carisma Establish Collaboration to Develop in vivo Engineered Chimeric Antigen Receptor Monocytes (CAR-M) for Oncology
- Moderna Announces First Participant Dosed in Phase 1 Study of its mRNA Epstein-Barr Virus (EBV) Vaccine
- Moderna to Present at the Goldman Sachs 14th Annual Healthcare CEOs Unscripted Conference
- Moderna to Provide Business and Pipeline Updates at the 2022 J.P. Morgan Healthcare Conference
About author

Online


Add a comment
Comments
0 comments on the analysis MODERNA INC. - Daily