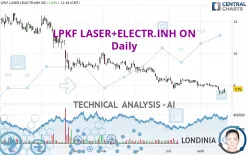
LPKF LASER+ELECTR.INH ON - Daily - Technical analysis published on 08/23/2023 (GMT)
- 177
- 0
Click here for a new analysis!
- Timeframe : Daily
- - Analysis generated on
- Status : TARGET REACHED

Summary of the analysis

Additional analysis
Quotes
The LPKF LASER+ELECTR.INH ON rating is 7.750 EUR. The price has increased by +1.84% since the last closing and was traded between 7.505 EUR and 7.775 EUR over the period. The price is currently at +3.26% from its lowest and -0.32% from its highest.A bearish opening was detected by the Central Gaps scanner. Sellers are trying to impose a bearish trend in the very short term.
Bearish opening
Type : Bearish
Timeframe : Openning
A study of price movements over other periods shows the following variations:
Near a new LOW record (1st january)
Type : Bearish
Timeframe : Weekly
Near a new LOW record (1 month)
Type : Bearish
Timeframe : Weekly
Technical
Technical analysis of LPKF LASER+ELECTR.INH ON in Daily shows a overall strongly bearish trend. 92.86% of the signals given by moving averages are bearish. This strongly bearish trend is supported by the strong bearish signals given by short-term moving averages. The Central Indicators scanner does not detect any result on moving averages that would impact this trend.
An assessment of technical indicators does not currently provide any relevant information on the direction of future price movements.
Caution: the Central Indicators scanner currently detects an excess:
CCI indicator is oversold : under -100
Type : Neutral
Timeframe : Daily
Pivot points : price is over resistance 2
Type : Neutral
Timeframe : Daily
Price is back over the pivot point
Type : Bullish
Timeframe : Weekly
Central Patterns, the scanner specializing in chart patterns, did not identify any signals.
The Central Candlesticks scanner, specialised in Japanese candlesticks, did not identify any signals.
| S3 | S2 | S1 | Price | R1 | R2 | R3 | |
|---|---|---|---|---|---|---|---|
| ProTrendLines | 0.748 | 3.301 | 7.211 | 7.750 | 7.975 | 9.983 | 10.645 |
| Change (%) | -90.35% | -57.41% | -6.95% | - | +2.90% | +28.81% | +37.35% |
| Change | -7.002 | -4.449 | -0.539 | - | +0.225 | +2.233 | +2.895 |
| Level | Minor | Minor | Major | - | Intermediate | Intermediate | Intermediate |
Attention could also be paid to pivot points to set price objectives:
| Pivot points | S3 | S2 | S1 | PP | R1 | R2 | R3 |
|---|---|---|---|---|---|---|---|
| Standard | 7.418 | 7.457 | 7.533 | 7.572 | 7.648 | 7.687 | 7.763 |
| Camarilla | 7.578 | 7.589 | 7.600 | 7.610 | 7.621 | 7.631 | 7.642 |
| Woodie | 7.438 | 7.466 | 7.553 | 7.581 | 7.668 | 7.696 | 7.783 |
| Fibonacci | 7.457 | 7.501 | 7.528 | 7.572 | 7.616 | 7.643 | 7.687 |
| Pivot points | S3 | S2 | S1 | PP | R1 | R2 | R3 |
|---|---|---|---|---|---|---|---|
| Standard | 6.617 | 6.993 | 7.247 | 7.623 | 7.877 | 8.253 | 8.507 |
| Camarilla | 7.327 | 7.385 | 7.442 | 7.500 | 7.558 | 7.616 | 7.673 |
| Woodie | 6.555 | 6.963 | 7.185 | 7.593 | 7.815 | 8.223 | 8.445 |
| Fibonacci | 6.993 | 7.234 | 7.383 | 7.623 | 7.864 | 8.013 | 8.253 |
| Pivot points | S3 | S2 | S1 | PP | R1 | R2 | R3 |
|---|---|---|---|---|---|---|---|
| Standard | 6.943 | 7.362 | 7.698 | 8.117 | 8.453 | 8.872 | 9.208 |
| Camarilla | 7.827 | 7.897 | 7.966 | 8.035 | 8.104 | 8.173 | 8.243 |
| Woodie | 6.903 | 7.341 | 7.658 | 8.096 | 8.413 | 8.851 | 9.168 |
| Fibonacci | 7.362 | 7.650 | 7.828 | 8.117 | 8.405 | 8.583 | 8.872 |
Numerical data
The following is the status of the technical indicators and moving averages at the time of publication of this technical analysis:
| RSI (14): | 39.77 | |
| MACD (12,26,9): | -0.1640 | |
| Directional Movement: | -14.452 | |
| AROON (14): | -64.285 | |
| DEMA (21): | 7.672 | |
| Parabolic SAR (0,02-0,02-0,2): | 8.117 | |
| Elder Ray (13): | -0.157 | |
| Super Trend (3,10): | 7.999 | |
| Zig ZAG (10): | 7.760 | |
| VORTEX (21): | 0.8230 | |
| Stochastique (14,3,5): | 31.62 | |
| TEMA (21): | 7.645 | |
| Williams %R (14): | -50.00 | |
| Chande Momentum Oscillator (20): | -0.320 | |
| Repulse (5,40,3): | 4.1220 | |
| ROCnROLL: | 2 | |
| TRIX (15,9): | -0.2410 | |
| Courbe Coppock: | 8.74 |
| MA7: | 7.699 | |
| MA20: | 7.913 | |
| MA50: | 8.156 | |
| MA100: | 8.706 | |
| MAexp7: | 7.708 | |
| MAexp20: | 7.882 | |
| MAexp50: | 8.208 | |
| MAexp100: | 8.692 | |
| Price / MA7: | +0.66% | |
| Price / MA20: | -2.06% | |
| Price / MA50: | -4.98% | |
| Price / MA100: | -10.98% | |
| Price / MAexp7: | +0.54% | |
| Price / MAexp20: | -1.67% | |
| Price / MAexp50: | -5.58% | |
| Price / MAexp100: | -10.84% |
News
Don't forget to follow the news on LPKF LASER+ELECTR.INH ON. At the time of publication of this analysis, the latest news was as follows:
- EQS-News: LPKF remains on track in the first half of 2023
- LPKF moves ARRALYZE into BioLabs Boston
- EQS-News: LPKF Laser & Electronics SE: Strong order book in first quarter supports growth trajectory
- EQS-News: LPKF Laser & Electronics SE: LPKF significantly increases revenue and earnings in the 2022 financial year
- EQS-Adhoc: LPKF closes contract with leading semiconductor company
About author
Online


Add a comment
Comments
0 comments on the analysis LPKF LASER+ELECTR.INH ON - Daily