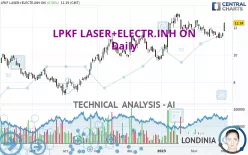
LPKF LASER+ELECTR.INH ON - Daily - Technical analysis published on 03/01/2023 (GMT)
- 223
- 0
Click here for a new analysis!
- Timeframe : Daily
- - Analysis generated on
- Status : INVALID

Summary of the analysis

Additional analysis
Quotes
LPKF LASER+ELECTR.INH ON rating 12.34 EUR. On the day, this instrument gained +6.56% with the lowest point at 11.74 EUR and the highest point at 12.38 EUR. The deviation from the price is +5.11% for the low point and -0.32% for the high point.The Central Gaps scanner detects a bullish gap which is a sign that buyers have taken the lead in the very short term.
Opening Gap UP
Type : Bullish
Timeframe : Openning
Here is a more detailed summary of the historical variations registered by LPKF LASER+ELECTR.INH ON:
Near a new LOW record (1 month)
Type : Bearish
Timeframe : Weekly
Technical
Technical analysis of this Daily chart of LPKF LASER+ELECTR.INH ON indicates that the overall trend is strongly bullish. 92.86% of the signals given by moving averages are bullish. The overall trend is supported by the strong bullish signals from short-term moving averages. The Central Indicators scanner detects bullish signals on moving averages that could impact this trend:
Bullish trend reversal : adaptative moving average 50
Type : Bullish
Timeframe : Daily
Bullish price crossover with Moving Average 20
Type : Bullish
Timeframe : Daily
Bullish price crossover with adaptative moving average 20
Type : Bullish
Timeframe : Daily
In fact, according to the parameters integrated into the Central Analyzer system, 11 technical indicators out of 18 analysed are currently bullish. Caution: the Central Indicators scanner currently detects an excess:
Williams %R indicator is overbought : over -20
Type : Neutral
Timeframe : Daily
Pivot points : price is over resistance 3
Type : Neutral
Timeframe : Daily
Pivot points : price is over resistance 3
Type : Neutral
Timeframe : Weekly
RSI indicator is back over 50
Type : Bullish
Timeframe : Daily
MACD crosses UP its Moving Average
Type : Bullish
Timeframe : Daily
Parabolic SAR indicator bullish reversal
Type : Bullish
Timeframe : Daily
Aroon indicator bullish trend
Type : Bullish
Timeframe : Daily
Ichimoku : price is over the cloud
Type : Bullish
Timeframe : Daily
An analysis of the price chart with the Central Patterns scanner (detector of chart patterns and resistances and supports) shows several results that can have an impact on the price change:
Horizontal resistance is broken
Type : Bullish
Timeframe : Daily
Resistance of channel is broken
Type : Bullish
Timeframe : Daily
The presence of a bullish Japanese candlestick pattern detected by Central Candlesticks that could cause a very short term rebound was also detected:
Upside gap
Type : Bullish
Timeframe : Daily
| S3 | S2 | S1 | Price | R1 | R2 | R3 | |
|---|---|---|---|---|---|---|---|
| ProTrendLines | 10.65 | 11.38 | 11.82 | 12.34 | 12.53 | 12.98 | 15.70 |
| Change (%) | -13.70% | -7.78% | -4.21% | - | +1.54% | +5.19% | +27.23% |
| Change | -1.69 | -0.96 | -0.52 | - | +0.19 | +0.64 | +3.36 |
| Level | Major | Major | Major | - | Intermediate | Intermediate | Intermediate |
To determine price objectives, it is also possible to use the pivot points. Here is the price position in relation to pivot points:
| Pivot points | S3 | S2 | S1 | PP | R1 | R2 | R3 |
|---|---|---|---|---|---|---|---|
| Standard | 11.03 | 11.15 | 11.37 | 11.49 | 11.71 | 11.83 | 12.05 |
| Camarilla | 11.49 | 11.52 | 11.55 | 11.58 | 11.61 | 11.64 | 11.67 |
| Woodie | 11.07 | 11.18 | 11.41 | 11.52 | 11.75 | 11.86 | 12.09 |
| Fibonacci | 11.15 | 11.28 | 11.36 | 11.49 | 11.62 | 11.70 | 11.83 |
| Pivot points | S3 | S2 | S1 | PP | R1 | R2 | R3 |
|---|---|---|---|---|---|---|---|
| Standard | 10.49 | 10.84 | 11.04 | 11.39 | 11.59 | 11.94 | 12.14 |
| Camarilla | 11.09 | 11.14 | 11.19 | 11.24 | 11.29 | 11.34 | 11.39 |
| Woodie | 10.42 | 10.80 | 10.97 | 11.35 | 11.52 | 11.90 | 12.07 |
| Fibonacci | 10.84 | 11.05 | 11.18 | 11.39 | 11.60 | 11.73 | 11.94 |
| Pivot points | S3 | S2 | S1 | PP | R1 | R2 | R3 |
|---|---|---|---|---|---|---|---|
| Standard | 9.66 | 10.43 | 11.00 | 11.77 | 12.34 | 13.11 | 13.68 |
| Camarilla | 11.21 | 11.33 | 11.46 | 11.58 | 11.70 | 11.83 | 11.95 |
| Woodie | 9.57 | 10.38 | 10.91 | 11.72 | 12.25 | 13.06 | 13.59 |
| Fibonacci | 10.43 | 10.94 | 11.26 | 11.77 | 12.28 | 12.60 | 13.11 |
Numerical data
The following are the details of the technical indicators and moving averages that were collected to generate this technical analysis:
| RSI (14): | 59.05 | |
| MACD (12,26,9): | -0.0300 | |
| Directional Movement: | 12.52 | |
| AROON (14): | 35.71 | |
| DEMA (21): | 11.68 | |
| Parabolic SAR (0,02-0,02-0,2): | 11.19 | |
| Elder Ray (13): | 0.39 | |
| Super Trend (3,10): | 12.41 | |
| Zig ZAG (10): | 12.29 | |
| VORTEX (21): | 0.9200 | |
| Stochastique (14,3,5): | 47.65 | |
| TEMA (21): | 11.51 | |
| Williams %R (14): | -7.56 | |
| Chande Momentum Oscillator (20): | 0.65 | |
| Repulse (5,40,3): | 6.1400 | |
| ROCnROLL: | 1 | |
| TRIX (15,9): | -0.0600 | |
| Courbe Coppock: | 5.70 |
| MA7: | 11.52 | |
| MA20: | 11.77 | |
| MA50: | 11.58 | |
| MA100: | 10.78 | |
| MAexp7: | 11.67 | |
| MAexp20: | 11.70 | |
| MAexp50: | 11.50 | |
| MAexp100: | 11.02 | |
| Price / MA7: | +7.12% | |
| Price / MA20: | +4.84% | |
| Price / MA50: | +6.56% | |
| Price / MA100: | +14.47% | |
| Price / MAexp7: | +5.74% | |
| Price / MAexp20: | +5.47% | |
| Price / MAexp50: | +7.30% | |
| Price / MAexp100: | +11.98% |
News
Don't forget to follow the news on LPKF LASER+ELECTR.INH ON. At the time of publication of this analysis, the latest news was as follows:
- EQS-Adhoc: LPKF closes contract with leading semiconductor company
- EQS-Adhoc: LPKF Laser & Electronics Aktiengesellschaft: LPKF receives further major order from the solar industry
- EQS-News: LPKF Laser & Electronics Aktiengesellschaft: LPKF hits the upper range of its Q3 targets
- DGAP-News: LPKF hits the upper range of its H1 targets
- DGAP-Adhoc: LPKF removes midterm forecast for 2024 but confirms its growth potential and its forecast 2022
About author
Online


Add a comment
Comments
0 comments on the analysis LPKF LASER+ELECTR.INH ON - Daily