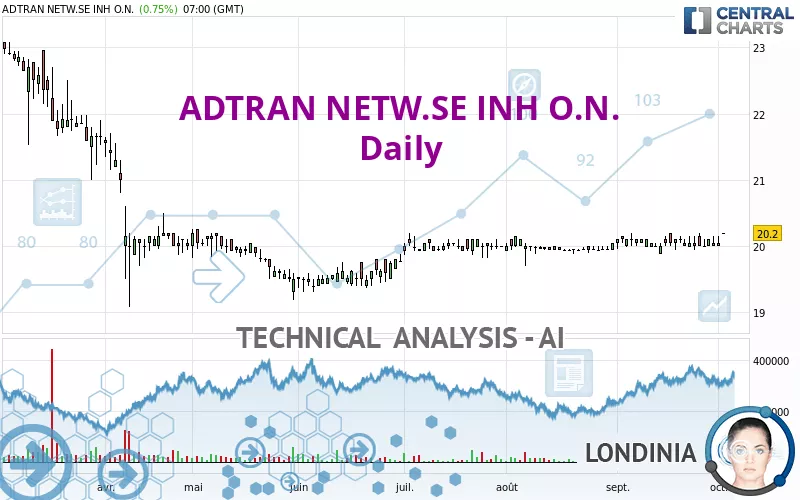
ADTRAN NETW.SE INH O.N. - Daily - Technical analysis published on 10/03/2023 (GMT)
- 188
- 0
Click here for a new analysis!
- Timeframe : Daily
- - Analysis generated on
- Status : LEVEL MAINTAINED
Summary of the analysis

Additional analysis
Quotes
ADTRAN NETW.SE INH O.N. rating 20.20 EUR. On the day, this instrument gained +0.75% and was between 20.20 EUR and 20.20 EUR. This implies that the price is at 0% from its lowest and at 0% from its highest.A bullish gap was detected at the opening by the Central Gaps scanner. There are a lot of buyers and they have the upper hand in the very short term.
Opening Gap UP
Type : Bullish
Timeframe : Openning
A study of price movements over other periods shows the following variations:
New HIGH record (1 month)
Type : Bullish
Timeframe : Weekly
Technical
Technical analysis of ADTRAN NETW.SE INH O.N. in Daily shows a strongly overall bullish trend. 85.71% of the signals given by moving averages are bullish. The overall trend is supported by the strong bullish signals from short-term moving averages. An assessment of moving averages reveals several bullish signals that could impact this trend:
Bullish price crossover with Moving Average 20
Type : Bullish
Timeframe : Daily
Bullish price crossover with adaptative moving average 20
Type : Bullish
Timeframe : Daily
The probability of a further increase are moderate given the direction of the technical indicators.
But beware of excesses. The Central Indicators scanner currently detects this:
CCI indicator is overbought : over 100
Type : Neutral
Timeframe : Daily
Williams %R indicator is overbought : over -20
Type : Neutral
Timeframe : Daily
Pivot points : price is over resistance 1
Type : Neutral
Timeframe : Daily
Pivot points : price is over resistance 1
Type : Neutral
Timeframe : Weekly
MACD crosses UP its Moving Average
Type : Bullish
Timeframe : Daily
Central Patterns, the market scanner focusing on chart patterns, resistances and supports found these results:
Resistance of channel is broken
Type : Bullish
Timeframe : Daily
Resistance of triangle is broken
Type : Bullish
Timeframe : Daily
The presence of these Japanese chandelier patterns detected by Central Candlesticks that could impact the current short-term trend were also noted:
Bearish doji star
Type : Bearish
Timeframe : Daily
Doji
Type : Neutral
Timeframe : Daily
| S3 | S2 | S1 | Price | R1 | R2 | R3 | |
|---|---|---|---|---|---|---|---|
| ProTrendLines | 14.26 | 19.40 | 20.06 | 20.20 | 21.87 | 22.39 | 23.16 |
| Change (%) | -29.41% | -3.96% | -0.69% | - | +8.27% | +10.84% | +14.65% |
| Change | -5.94 | -0.80 | -0.14 | - | +1.67 | +2.19 | +2.96 |
| Level | Major | Minor | Intermediate | - | Minor | Intermediate | Major |
Pivot points can also be used to set your price objectives. Here is the price situation in relation to pivot points:
| Pivot points | S3 | S2 | S1 | PP | R1 | R2 | R3 |
|---|---|---|---|---|---|---|---|
| Standard | 19.83 | 19.92 | 19.98 | 20.07 | 20.13 | 20.22 | 20.28 |
| Camarilla | 20.01 | 20.02 | 20.04 | 20.05 | 20.06 | 20.08 | 20.09 |
| Woodie | 19.83 | 19.91 | 19.98 | 20.06 | 20.13 | 20.21 | 20.28 |
| Fibonacci | 19.92 | 19.97 | 20.01 | 20.07 | 20.12 | 20.16 | 20.22 |
| Pivot points | S3 | S2 | S1 | PP | R1 | R2 | R3 |
|---|---|---|---|---|---|---|---|
| Standard | 19.67 | 19.80 | 19.93 | 20.06 | 20.19 | 20.32 | 20.45 |
| Camarilla | 19.98 | 20.00 | 20.03 | 20.05 | 20.07 | 20.10 | 20.12 |
| Woodie | 19.66 | 19.80 | 19.92 | 20.06 | 20.18 | 20.32 | 20.44 |
| Fibonacci | 19.80 | 19.90 | 19.96 | 20.06 | 20.16 | 20.22 | 20.32 |
| Pivot points | S3 | S2 | S1 | PP | R1 | R2 | R3 |
|---|---|---|---|---|---|---|---|
| Standard | 19.57 | 19.72 | 19.89 | 20.04 | 20.21 | 20.36 | 20.53 |
| Camarilla | 19.96 | 19.99 | 20.02 | 20.05 | 20.08 | 20.11 | 20.14 |
| Woodie | 19.57 | 19.73 | 19.89 | 20.05 | 20.21 | 20.37 | 20.53 |
| Fibonacci | 19.72 | 19.85 | 19.92 | 20.04 | 20.17 | 20.24 | 20.36 |
Numerical data
The following is the status of the technical indicators and moving averages at the time of publication of this technical analysis:
| RSI (14): | 65.51 | |
| MACD (12,26,9): | 0.0200 | |
| Directional Movement: | 6.68 | |
| AROON (14): | 14.29 | |
| DEMA (21): | 20.08 | |
| Parabolic SAR (0,02-0,02-0,2): | 19.94 | |
| Elder Ray (13): | 0.13 | |
| Super Trend (3,10): | 19.84 | |
| Zig ZAG (10): | 20.20 | |
| VORTEX (21): | 0.9800 | |
| Stochastique (14,3,5): | 68.75 | |
| TEMA (21): | 20.08 | |
| Williams %R (14): | 0.00 | |
| Chande Momentum Oscillator (20): | 0.15 | |
| Repulse (5,40,3): | -0.0700 | |
| ROCnROLL: | 1 | |
| TRIX (15,9): | 0.0100 | |
| Courbe Coppock: | 0.08 |
| MA7: | 20.06 | |
| MA20: | 20.06 | |
| MA50: | 20.02 | |
| MA100: | 19.89 | |
| MAexp7: | 20.08 | |
| MAexp20: | 20.05 | |
| MAexp50: | 20.03 | |
| MAexp100: | 20.11 | |
| Price / MA7: | +0.70% | |
| Price / MA20: | +0.70% | |
| Price / MA50: | +0.90% | |
| Price / MA100: | +1.56% | |
| Price / MAexp7: | +0.60% | |
| Price / MAexp20: | +0.75% | |
| Price / MAexp50: | +0.85% | |
| Price / MAexp100: | +0.45% |
News
Don't forget to follow the news on ADTRAN NETW.SE INH O.N.. At the time of publication of this analysis, the latest news was as follows:
- EQS-News: Adtran Networks SE reports second quarter 2023 results
- Adtran Networks SE reports second quarter 2023 results
- EQS-Adhoc: Adtran Networks SE: Adtran Networks SE updates guidance for the financial year 2023
- EQS-News: Changes in the Supervisory Board of Adtran Networks SE
- ADVA Optical Networking SE changes name to Adtran Networks SE
About author
Online


Add a comment
Comments
0 comments on the analysis ADTRAN NETW.SE INH O.N. - Daily