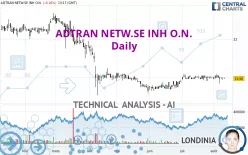
ADTRAN NETW.SE INH O.N. - Daily - Technical analysis published on 08/10/2023 (GMT)
- 254
- 0
Click here for a new analysis!
- Timeframe : Daily
- - Analysis generated on
- Status : LEVEL MAINTAINED

Summary of the analysis

Additional analysis
Quotes
The ADTRAN NETW.SE INH O.N. price is 19.96 EUR. The price registered a decrease of -0.10% on the session and was traded between 19.96 EUR and 20.00 EUR over the period. The price is currently at 0% from its lowest and -0.20% from its highest.The Central Gaps scanner detects a bearish opening. A small advantage for sellers in the very short term.
Bearish opening
Type : Bearish
Timeframe : Openning
Here is a more detailed summary of the historical variations registered by ADTRAN NETW.SE INH O.N.:
Near a new LOW record (1st january)
Type : Bearish
Timeframe : Weekly
Near a new LOW record (1 month)
Type : Bearish
Timeframe : Weekly
Technical
Technical analysis of this Daily chart of ADTRAN NETW.SE INH O.N. indicates that the overall trend is bearish. 67.86% of the signals given by moving averages are bearish. Caution: as the signals currently given by short-term moving averages are rather neutral, the bearish trend could slow down. An assessment of moving averages reveals several bearish signals that could impact this trend:
Bearish trend reversal : adaptative moving average 20
Type : Bearish
Timeframe : Daily
Bearish trend reversal : adaptative moving average 50
Type : Bearish
Timeframe : Daily
An assessment of technical indicators does not currently provide any relevant information to suggest whether the signal given by the technical indicators is more bullish or bearish.
The Central Indicators scanner found this result concerning these indicators:
RSI indicator is back under 50
Type : Bearish
Timeframe : Daily
Central Patterns, the market scanner focusing on chart patterns, resistances and supports found these results:
Near horizontal resistance
Type : Bearish
Timeframe : Daily
Near resistance of channel
Type : Bearish
Timeframe : Daily
Near resistance of triangle
Type : Bearish
Timeframe : Daily
Central Candlesticks, the scanner specialised in Japanese candlesticks, detects this inversion signal that could impact the current short-term trend:
Doji
Type : Neutral
Timeframe : Daily
| S3 | S2 | S1 | Price | R1 | R2 | R3 | |
|---|---|---|---|---|---|---|---|
| ProTrendLines | 11.80 | 14.26 | 19.40 | 19.96 | 20.02 | 20.75 | 21.87 |
| Change (%) | -40.88% | -28.56% | -2.81% | - | +0.30% | +3.96% | +9.57% |
| Change | -8.16 | -5.70 | -0.56 | - | +0.06 | +0.79 | +1.91 |
| Level | Major | Intermediate | Major | - | Major | Minor | Minor |
Attention could also be paid to pivot points to set price objectives:
| Pivot points | S3 | S2 | S1 | PP | R1 | R2 | R3 |
|---|---|---|---|---|---|---|---|
| Standard | 19.79 | 19.83 | 19.91 | 19.95 | 20.03 | 20.07 | 20.15 |
| Camarilla | 19.95 | 19.96 | 19.97 | 19.98 | 19.99 | 20.00 | 20.01 |
| Woodie | 19.80 | 19.84 | 19.92 | 19.96 | 20.04 | 20.08 | 20.16 |
| Fibonacci | 19.83 | 19.88 | 19.91 | 19.95 | 20.00 | 20.03 | 20.07 |
| Pivot points | S3 | S2 | S1 | PP | R1 | R2 | R3 |
|---|---|---|---|---|---|---|---|
| Standard | 19.73 | 19.83 | 19.96 | 20.06 | 20.19 | 20.29 | 20.42 |
| Camarilla | 20.04 | 20.06 | 20.08 | 20.10 | 20.12 | 20.14 | 20.16 |
| Woodie | 19.76 | 19.84 | 19.99 | 20.07 | 20.22 | 20.30 | 20.45 |
| Fibonacci | 19.83 | 19.92 | 19.97 | 20.06 | 20.15 | 20.20 | 20.29 |
| Pivot points | S3 | S2 | S1 | PP | R1 | R2 | R3 |
|---|---|---|---|---|---|---|---|
| Standard | 19.43 | 19.63 | 19.81 | 20.01 | 20.19 | 20.39 | 20.57 |
| Camarilla | 19.90 | 19.93 | 19.97 | 20.00 | 20.04 | 20.07 | 20.11 |
| Woodie | 19.43 | 19.63 | 19.81 | 20.01 | 20.19 | 20.39 | 20.57 |
| Fibonacci | 19.63 | 19.77 | 19.86 | 20.01 | 20.15 | 20.24 | 20.39 |
Numerical data
The following is the status of technical indicators and moving averages registered at the time this technical analysis was created:
| RSI (14): | 48.93 | |
| MACD (12,26,9): | 0.0300 | |
| Directional Movement: | -8.49 | |
| AROON (14): | -14.28 | |
| DEMA (21): | 20.05 | |
| Parabolic SAR (0,02-0,02-0,2): | 20.12 | |
| Elder Ray (13): | -0.03 | |
| Super Trend (3,10): | 19.61 | |
| Zig ZAG (10): | 19.96 | |
| VORTEX (21): | 0.9600 | |
| Stochastique (14,3,5): | 62.22 | |
| TEMA (21): | 20.04 | |
| Williams %R (14): | -42.22 | |
| Chande Momentum Oscillator (20): | -0.04 | |
| Repulse (5,40,3): | 0.7300 | |
| ROCnROLL: | 2 | |
| TRIX (15,9): | 0.0400 | |
| Courbe Coppock: | 0.04 |
| MA7: | 20.03 | |
| MA20: | 20.02 | |
| MA50: | 19.83 | |
| MA100: | 20.11 | |
| MAexp7: | 20.00 | |
| MAexp20: | 19.99 | |
| MAexp50: | 19.99 | |
| MAexp100: | 20.20 | |
| Price / MA7: | -0.35% | |
| Price / MA20: | -0.30% | |
| Price / MA50: | +0.66% | |
| Price / MA100: | -0.75% | |
| Price / MAexp7: | -0.20% | |
| Price / MAexp20: | -0.15% | |
| Price / MAexp50: | -0.15% | |
| Price / MAexp100: | -1.19% |
News
The last news published on ADTRAN NETW.SE INH O.N. at the time of the generation of this analysis was as follows:
- EQS-News: Adtran Networks SE reports second quarter 2023 results
- Adtran Networks SE reports second quarter 2023 results
- EQS-Adhoc: Adtran Networks SE: Adtran Networks SE updates guidance for the financial year 2023
- EQS-News: Changes in the Supervisory Board of Adtran Networks SE
- ADVA Optical Networking SE changes name to Adtran Networks SE
About author
Online


Add a comment
Comments
0 comments on the analysis ADTRAN NETW.SE INH O.N. - Daily