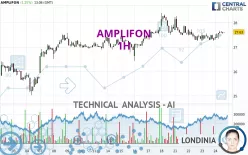
AMPLIFON - 1H - Technical analysis published on 10/24/2024 (GMT)
- 126
- 0
Click here for a new analysis!
- Timeframe : 1H
- - Analysis generated on
- Status : LEVEL MAINTAINED

Summary of the analysis

Additional analysis
Quotes
AMPLIFON rating 27.63 EUR. On the day, this instrument gained +1.25% with the lowest point at 27.30 EUR and the highest point at 27.67 EUR. The deviation from the price is +1.21% for the low point and -0.14% for the high point.A bullish opening was detected by the Central Gaps scanner. Buyers are trying to impose a bullish momentum in the very short term.
Bullish opening
Type : Bullish
Timeframe : Openning
A study of price movements over other periods shows the following variations:
Near a new HIGH record (1 month)
Type : Bullish
Timeframe : Weekly
Technical
Technical analysis of this 1H chart of AMPLIFON indicates that the overall trend is strongly bullish. 89.29% of the signals given by moving averages are bullish. The overall trend is supported by the strong bullish signals from short-term moving averages. The Central Indicators scanner detects bullish signals on moving averages that could impact this trend:
Bullish price crossover with Moving Average 50
Type : Bullish
Timeframe : 1 hour
Bullish price crossover with adaptative moving average 20
Type : Bullish
Timeframe : 1 hour
Technical indicators are strongly bullish, suggesting that the price increase should continue.
Caution: the Central Indicators scanner currently detects an excess:
CCI indicator is overbought : over 100
Type : Neutral
Timeframe : 1 hour
Pivot points : price is over resistance 1
Type : Neutral
Timeframe : 1 hour
MACD indicator is back over 0
Type : Bullish
Timeframe : 1 hour
Central Patterns, the market scanner focusing on chart patterns, resistances and supports found this result:
Near horizontal resistance
Type : Bearish
Timeframe : 1 hour
For a small rebound in the very short term, the Central Candlesticks scanner currently notes the presence of this bullish pattern in Japanese candlesticks:
Bullish harami cross
Type : Bullish
Timeframe : 1 hour
| S3 | S2 | S1 | Price | R1 | R2 | R3 | |
|---|---|---|---|---|---|---|---|
| ProTrendLines | 26.43 | 26.89 | 27.54 | 27.63 | 27.89 | 28.40 | 29.42 |
| Change (%) | -4.34% | -2.68% | -0.33% | - | +0.94% | +2.79% | +6.48% |
| Change | -1.20 | -0.74 | -0.09 | - | +0.26 | +0.77 | +1.79 |
| Level | Intermediate | Intermediate | Major | - | Minor | Intermediate | Major |
To determine price objectives, it is also possible to use the pivot points. Here is the price position in relation to pivot points:
| Pivot points | S3 | S2 | S1 | PP | R1 | R2 | R3 |
|---|---|---|---|---|---|---|---|
| Standard | 26.84 | 27.05 | 27.17 | 27.38 | 27.50 | 27.71 | 27.83 |
| Camarilla | 27.20 | 27.23 | 27.26 | 27.29 | 27.32 | 27.35 | 27.38 |
| Woodie | 26.80 | 27.03 | 27.13 | 27.36 | 27.46 | 27.69 | 27.79 |
| Fibonacci | 27.05 | 27.18 | 27.25 | 27.38 | 27.51 | 27.58 | 27.71 |
| Pivot points | S3 | S2 | S1 | PP | R1 | R2 | R3 |
|---|---|---|---|---|---|---|---|
| Standard | 24.71 | 25.57 | 26.67 | 27.53 | 28.63 | 29.49 | 30.59 |
| Camarilla | 27.22 | 27.40 | 27.58 | 27.76 | 27.94 | 28.12 | 28.30 |
| Woodie | 24.82 | 25.63 | 26.78 | 27.59 | 28.74 | 29.55 | 30.70 |
| Fibonacci | 25.57 | 26.32 | 26.79 | 27.53 | 28.28 | 28.75 | 29.49 |
| Pivot points | S3 | S2 | S1 | PP | R1 | R2 | R3 |
|---|---|---|---|---|---|---|---|
| Standard | 21.23 | 23.48 | 24.65 | 26.90 | 28.07 | 30.32 | 31.49 |
| Camarilla | 24.87 | 25.18 | 25.50 | 25.81 | 26.12 | 26.44 | 26.75 |
| Woodie | 20.68 | 23.21 | 24.10 | 26.63 | 27.52 | 30.05 | 30.94 |
| Fibonacci | 23.48 | 24.79 | 25.60 | 26.90 | 28.21 | 29.02 | 30.32 |
Numerical data
The following are the details of the technical indicators and moving averages that were collected to generate this technical analysis:
| RSI (14): | 53.20 | |
| MACD (12,26,9): | 0.0000 | |
| Directional Movement: | 8.72 | |
| AROON (14): | 85.71 | |
| DEMA (21): | 27.49 | |
| Parabolic SAR (0,02-0,02-0,2): | 27.32 | |
| Elder Ray (13): | 0.08 | |
| Super Trend (3,10): | 27.82 | |
| Zig ZAG (10): | 27.58 | |
| VORTEX (21): | 1.0100 | |
| Stochastique (14,3,5): | 84.55 | |
| TEMA (21): | 27.51 | |
| Williams %R (14): | -21.95 | |
| Chande Momentum Oscillator (20): | 0.11 | |
| Repulse (5,40,3): | 0.2000 | |
| ROCnROLL: | 1 | |
| TRIX (15,9): | -0.0200 | |
| Courbe Coppock: | 0.71 |
| MA7: | 27.54 | |
| MA20: | 26.94 | |
| MA50: | 27.55 | |
| MA100: | 29.40 | |
| MAexp7: | 27.54 | |
| MAexp20: | 27.50 | |
| MAexp50: | 27.49 | |
| MAexp100: | 27.34 | |
| Price / MA7: | +0.33% | |
| Price / MA20: | +2.56% | |
| Price / MA50: | +0.29% | |
| Price / MA100: | -6.02% | |
| Price / MAexp7: | +0.33% | |
| Price / MAexp20: | +0.47% | |
| Price / MAexp50: | +0.51% | |
| Price / MAexp100: | +1.06% |
News
The last news published on AMPLIFON at the time of the generation of this analysis was as follows:
- Amplifon named to Newsweek’s list of the Top 100 Global Most Loved Workplaces for 2023
- World Hearing Day 2023: Amplifon Supports the World Health Organization’s Commitment to Early Diagnosis by Promoting Free Screening Tests
- Amplifon Americas Recognized as a ‘Top Employer’ in the U.S.
- New Research Shows Consumers Highly Value Broad Product Choice and Provider Expertise in Health Plan Hearing Benefits
- World Hearing Day 2022: Amplifon Joins “To Hear For Life, Listen With Care” Global WHO Campaign
About author
Online


Add a comment
Comments
0 comments on the analysis AMPLIFON - 1H