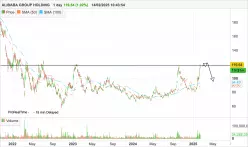
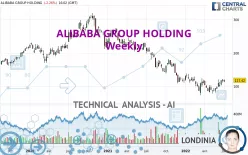
ALIBABA GROUP HOLDING
132.85
USD
(+4.65%)
04/07/2025 - 19:59
Closed 15 min delayed data - NYSE Stocks
| Open: | 124.97 |
| Change: | +5.90 |
| Volume: | 18,941,906 |
| Low: | 123.74 |
| High: | 141.57 |
| High / Low range: | 17.83 |
| Type: | Stocks |
| Ticker: | BABA |
| ISIN: |
ALIBABA GROUP HOLDING Technical Analyses
To filter analyses please use our advanced search feature.
ALIBABA GROUP HOLDING - More technical analyses...
ALIBABA GROUP HOLDING - More technical analyses...
- 0
- 93.3k
- 15.8k
- 0

Status : IN PROGRESS...
Simple chart
- 02/27/2025 - 12:56
- 100
- 0
- 0
- 11
- 62
- 40
- 0
Simple chart
- 02/14/2025 - 09:44
- 118
- 0
- 0
- 0
- 93.3k
- 15.8k
- 0
Status : INVALID
Simple chart
- 12/01/2024 - 14:16
- 123
- 0
- 0
- 0
- 93.3k
- 15.8k
- 0
Status : TARGET REACHED
Simple chart
- 09/19/2024 - 11:52
- 143
- 0
- 0
- 0
- 93.3k
- 15.8k
- 0
Status : LEVEL MAINTAINED
Simple chart
- 08/17/2024 - 13:17
- 323
- 0
- 0
- 22
- 896
- 489
- 0
Simple chart
- 05/20/2024 - 18:06
- 190
- 0
- 0
- 22
- 896
- 489
- 0

Simple chart
- 02/19/2024 - 18:21
- 212
- 0
- 1
- 17
- 343
- 52
- 0

Simple chart
- 01/31/2024 - 11:40
- 287
- 0
- 0
- 17
- 343
- 52
- 0

Simple chart
- 11/29/2023 - 12:52
- 414
- 0
- 0
- 17
- 343
- 52
- 0

Simple chart
- 08/03/2023 - 13:04
- 324
- 0
- 0
- 17
- 343
- 52
- 0

Simple chart
- 05/12/2023 - 09:34
- 311
- 0
- 0
- 0
- 93.3k
- 15.8k
- 0
Status : TARGET REACHED
Simple chart
- 07/06/2022 - 16:18
- 350
- 0
- 0

