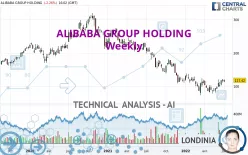
ALIBABA GROUP HOLDING - Weekly - Technical analysis published on 07/06/2022 (GMT)
- 342
- 0
Click here for a new analysis!
- Timeframe : Weekly
- - Analysis generated on
- Status : TARGET REACHED

Summary of the analysis

Additional analysis
Quotes
The ALIBABA GROUP HOLDING price is 117.42 USD. The price is up - over 5 days with the lowest point at - USD and the highest point at - USD. The deviation from the price is - for the low point and - for the high point.A bearish opening was detected by the Central Gaps scanner. Sellers are trying to impose a bearish trend in the very short term.
Bearish opening
Type : Bearish
Timeframe : Openning
So that you have an overall view of the price change, here is a table showing the variations over several periods:
Near a new HIGH record (1 month)
Type : Bullish
Timeframe : Weekly
Technical
Technical analysis of ALIBABA GROUP HOLDING in Weekly shows an overall bearish trend. 75.00% of the signals given by moving averages are bearish. Caution: as the signals currently given by short-term moving averages are rather neutral, the bearish trend could slow down. The Central Indicators scanner does not detect any result on moving averages that would impact this trend.
In fact, according to the parameters integrated into the Central Analyzer system, 12 technical indicators out of 18 analysed are currently bullish. But beware of excesses. The Central Indicators scanner currently detects this:
CCI indicator is overbought : over 100
Type : Neutral
Timeframe : Weekly
Williams %R indicator is overbought : over -20
Type : Neutral
Timeframe : Weekly
Aroon indicator bullish trend
Type : Bullish
Timeframe : Weekly
Price is back over the pivot point
Type : Bullish
Timeframe : Weekly
The Central Patterns scanner, which studies chart patterns, resistances and supports, has identified these signals:
Near resistance of channel
Type : Bearish
Timeframe : Weekly
Near horizontal support
Type : Bullish
Timeframe : Weekly
The Central Candlesticks scanner which studies Japanese candlesticks did not detect anything.
| S1 | Price | R1 | R2 | R3 | |
|---|---|---|---|---|---|
| ProTrendLines | 81.09 | 117.42 | 117.50 | 230.27 | 270.83 |
| Change (%) | -30.94% | - | +0.07% | +96.11% | +130.65% |
| Change | -36.33 | - | +0.08 | +112.85 | +153.41 |
| Level | Major | - | Major | Intermediate | Minor |
Attention could also be paid to pivot points to set price objectives:
| Pivot points | S3 | S2 | S1 | PP | R1 | R2 | R3 |
|---|---|---|---|---|---|---|---|
| Standard | 106.28 | 109.21 | 114.67 | 117.60 | 123.06 | 125.99 | 131.45 |
| Camarilla | 117.82 | 118.59 | 119.36 | 120.13 | 120.90 | 121.67 | 122.44 |
| Woodie | 107.55 | 109.84 | 115.94 | 118.23 | 124.33 | 126.62 | 132.72 |
| Fibonacci | 109.21 | 112.42 | 114.40 | 117.60 | 120.81 | 122.79 | 125.99 |
| Pivot points | S3 | S2 | S1 | PP | R1 | R2 | R3 |
|---|---|---|---|---|---|---|---|
| Standard | 101.13 | 106.25 | 111.13 | 116.25 | 121.13 | 126.25 | 131.13 |
| Camarilla | 113.25 | 114.17 | 115.08 | 116.00 | 116.92 | 117.83 | 118.75 |
| Woodie | 101.00 | 106.19 | 111.00 | 116.19 | 121.00 | 126.19 | 131.00 |
| Fibonacci | 106.25 | 110.07 | 112.43 | 116.25 | 120.07 | 122.43 | 126.25 |
| Pivot points | S3 | S2 | S1 | PP | R1 | R2 | R3 |
|---|---|---|---|---|---|---|---|
| Standard | 67.08 | 79.48 | 96.58 | 108.98 | 126.08 | 138.48 | 155.58 |
| Camarilla | 105.57 | 108.27 | 110.98 | 113.68 | 116.38 | 119.09 | 121.79 |
| Woodie | 69.43 | 80.66 | 98.93 | 110.16 | 128.43 | 139.66 | 157.93 |
| Fibonacci | 79.48 | 90.75 | 97.71 | 108.98 | 120.25 | 127.21 | 138.48 |
Numerical data
The following are the details of the technical indicators and moving averages that were collected to generate this technical analysis:
| RSI (14): | 52.74 | |
| MACD (12,26,9): | -5.2600 | |
| Directional Movement: | -0.12 | |
| AROON (14): | 50.00 | |
| DEMA (21): | 97.63 | |
| Parabolic SAR (0,02-0,02-0,2): | 82.18 | |
| Elder Ray (13): | 10.24 | |
| Super Trend (3,10): | 130.36 | |
| Zig ZAG (10): | 117.37 | |
| VORTEX (21): | 0.9700 | |
| Stochastique (14,3,5): | 88.17 | |
| TEMA (21): | 107.17 | |
| Williams %R (14): | -9.29 | |
| Chande Momentum Oscillator (20): | 21.88 | |
| Repulse (5,40,3): | 7.3200 | |
| ROCnROLL: | -1 | |
| TRIX (15,9): | -1.2800 | |
| Courbe Coppock: | 8.56 |
| MA7: | 116.96 | |
| MA20: | 110.94 | |
| MA50: | 98.64 | |
| MA100: | 102.23 | |
| MAexp7: | 109.17 | |
| MAexp20: | 107.80 | |
| MAexp50: | 131.40 | |
| MAexp100: | 159.67 | |
| Price / MA7: | +0.39% | |
| Price / MA20: | +5.84% | |
| Price / MA50: | +19.04% | |
| Price / MA100: | +14.86% | |
| Price / MAexp7: | +7.56% | |
| Price / MAexp20: | +8.92% | |
| Price / MAexp50: | -10.64% | |
| Price / MAexp100: | -26.46% |
News
The latest news and videos published on ALIBABA GROUP HOLDING at the time of the analysis were as follows:
- Alibaba Group Announces March Quarter and Full Fiscal Year 2022 Results
- Alibaba Group Will Announce March Quarter 2022 and Full Fiscal Year 2022 Results on May 26, 2022
- Alibaba Group Joins Low Carbon Patent Pledge to Accelerate the Adoption of Green Technology
- Alibaba Group Upsizes Share Repurchase to US$25 Billion from US$15 Billion, Appoints New Independent Director to Board
- Alibaba Group Announces December Quarter 2021 Results
About author

Online


Add a comment
Comments
0 comments on the analysis ALIBABA GROUP HOLDING - Weekly