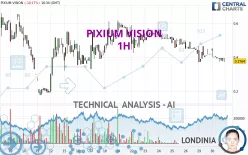
PIXIUM VISION - 1H - Technical analysis published on 02/06/2024 (GMT)
- 152
- 0
- Timeframe : 1H
- - Analysis generated on
- Status : CANCELLED

PIXIUM VISION Chart
Summary of the analysis
Trends
Short term:
Strongly bearish
Underlying:
Strongly bearish
Technical indicators
17%
56%
28%
My opinion
Bearish under 0.4377 EUR
My targets
0.3700 EUR (-1.70%)
0.3650 EUR (-3.03%)
My analysis
PIXIUM VISION is part of a very strong bearish trend. Traders may consider trading only short positions (for sale) as long as the price remains well below 0.4377 EUR. The next support located at 0.3700 EUR is the next bearish objective to target. A bearish break of this support would revive the bearish momentum. The bearish movement could then continue towards the next support located at 0.3650 EUR. Below this support, sellers could then target 0.1910 EUR. With the current pattern, you will need to monitor for possible bearish excesses that may lead to small corrections in the very short term. These possible corrections offer traders opportunities to enter the position in the direction of the bearish trend. Trying to profit from the purchase of these possible corrections may seem risky.
In the very short term, the general bearish sentiment is confirmed by technical indicators. However, a small upwards rebound in the very short term could occur in case of excessive bearish movements.
Force
0
10
7.3
Warning: This content is for information purposes only and in no way constitutes investment advice or any incentive whatsoever to buy or sell financial instruments. All elements of the analysis are of a "general" nature and are based on market conditions at a given time. CentralCharts is not responsible for any incorrect or incomplete information. Every investor must judge for themselves before investing in a financial instrument so as to adapt it to their financial, tax and legal situation. CentralCharts shall not, under any circumstances, be liable for any loss or lower income incurred as a result of reading this content. Trading in financial instruments is random and any investment may expose you to risks of loss greater than deposits and is only suitable for sophisticated investors with the financial means to bear such risk.
This analysis was given by Londinia.
Additional analysis
Quotes
The PIXIUM VISION price is 0.3764 EUR. The price is lower by -10.17% since the last closing and was between 0.3741 EUR and 0.4499 EUR. This implies that the price is at +0.61% from its lowest and at -16.34% from its highest.0.3741
0.4499
0.3764
So that you have an overall view of the price change, here is a table showing the variations over several periods:
Technical
A technical analysis in 1H of this PIXIUM VISION chart shows a sharp bearish trend. 92.86% of the signals given by moving averages are bearish. The overall trend is supported by the strong bearish signals from short-term moving averages. The Central Indicators scanner does not detect any result on moving averages that would impact this trend.
Technical indicators are bearish. There is still some doubt about the decline in the price.
No additional result has been identified by Central Indicators, the scanner specialised in technical indicators.
The analysis of the price chart with Central Patterns scanners does not return any result.
The Central Candlesticks scanner, specialised in Japanese candlesticks, did not identify any signals.
ProTrendLines
S2
S1
R1
R2
R3
Price
| S2 | S1 | Price | R1 | R2 | R3 | |
|---|---|---|---|---|---|---|
| ProTrendLines | 0.1910 | 0.3700 | 0.3764 | 0.4507 | 0.5499 | 0.7980 |
| Change (%) | -49.26% | -1.70% | - | +19.74% | +46.09% | +112.01% |
| Change | -0.1854 | -0.0064 | - | +0.0743 | +0.1735 | +0.4216 |
| Level | Major | Intermediate | - | Intermediate | Intermediate | Minor |
To determine price objectives, it is also possible to use the pivot points. Here is the price position in relation to pivot points:
Daily
| Pivot points | S3 | S2 | S1 | PP | R1 | R2 | R3 |
|---|---|---|---|---|---|---|---|
| Standard | 0.2761 | 0.3231 | 0.3710 | 0.4180 | 0.4659 | 0.5129 | 0.5608 |
| Camarilla | 0.3929 | 0.4016 | 0.4103 | 0.4190 | 0.4277 | 0.4364 | 0.4451 |
| Woodie | 0.2767 | 0.3233 | 0.3716 | 0.4182 | 0.4665 | 0.5131 | 0.5614 |
| Fibonacci | 0.3231 | 0.3593 | 0.3817 | 0.4180 | 0.4542 | 0.4766 | 0.5129 |
Weekly
| Pivot points | S3 | S2 | S1 | PP | R1 | R2 | R3 |
|---|---|---|---|---|---|---|---|
| Standard | 0.1970 | 0.3090 | 0.3650 | 0.4770 | 0.5330 | 0.6450 | 0.7010 |
| Camarilla | 0.3748 | 0.3902 | 0.4056 | 0.4210 | 0.4364 | 0.4518 | 0.4672 |
| Woodie | 0.1690 | 0.2950 | 0.3370 | 0.4630 | 0.5050 | 0.6310 | 0.6730 |
| Fibonacci | 0.3090 | 0.3732 | 0.4128 | 0.4770 | 0.5412 | 0.5808 | 0.6450 |
Monthly
| Pivot points | S3 | S2 | S1 | PP | R1 | R2 | R3 |
|---|---|---|---|---|---|---|---|
| Standard | -0.3803 | -0.1547 | 0.0287 | 0.2543 | 0.4377 | 0.6633 | 0.8467 |
| Camarilla | 0.0995 | 0.1370 | 0.1745 | 0.2120 | 0.2495 | 0.2870 | 0.3245 |
| Woodie | -0.4015 | -0.1653 | 0.0075 | 0.2438 | 0.4165 | 0.6528 | 0.8255 |
| Fibonacci | -0.1547 | 0.0016 | 0.0981 | 0.2543 | 0.4106 | 0.5071 | 0.6633 |
Numerical data
The following are the details of the technical indicators and moving averages that were collected to generate this technical analysis:
Technical indicators
Moving averages
| RSI (14): | 38.26 | |
| MACD (12,26,9): | -0.0204 | |
| Directional Movement: | 2.8835 | |
| AROON (14): | -78.5714 | |
| DEMA (21): | 0.3824 | |
| Parabolic SAR (0,02-0,02-0,2): | 0.4454 | |
| Elder Ray (13): | -0.0145 | |
| Super Trend (3,10): | 0.4460 | |
| Zig ZAG (10): | 0.3764 | |
| VORTEX (21): | 0.7275 | |
| Stochastique (14,3,5): | 10.91 | |
| TEMA (21): | 0.3793 | |
| Williams %R (14): | -96.97 | |
| Chande Momentum Oscillator (20): | -0.0356 | |
| Repulse (5,40,3): | -1.2792 | |
| ROCnROLL: | 2 | |
| TRIX (15,9): | -0.6754 | |
| Courbe Coppock: | 10.78 |
| MA7: | 0.4606 | |
| MA20: | 0.4606 | |
| MA50: | 0.2677 | |
| MA100: | 0.5976 | |
| MAexp7: | 0.3906 | |
| MAexp20: | 0.4101 | |
| MAexp50: | 0.4421 | |
| MAexp100: | 0.4489 | |
| Price / MA7: | -18.28% | |
| Price / MA20: | -18.28% | |
| Price / MA50: | +40.61% | |
| Price / MA100: | -37.01% | |
| Price / MAexp7: | -3.64% | |
| Price / MAexp20: | -8.22% | |
| Price / MAexp50: | -14.86% | |
| Price / MAexp100: | -16.15% |
Quotes :
-
15 min delayed data
-
Euronext Paris
News
Don't forget to follow the news on PIXIUM VISION. At the time of publication of this analysis, the latest news was as follows:
- Pixium Vision announces the opening of safeguard proceedings
- Pixium Vision announces the implementation of a bridge financing with Bpifrance and Sofinnova and a reverse stock split on the basis of 1 new share for 50 existing shares
- Pixium Vision announces the agreement to extend the maturity date of the outstanding notes associated with the terminated ESGO financing facility
- Annual Meeting of Shareholders June 13, 2023 / Availability of preparatory documents
- Pixium Vision announces its consolidated financial statements for the financial year 2022 and the consolidated cash balance for March 31, 2023
This member declared not having a position on this financial instrument or a related financial instrument.
About author

Online
I am Londinia, an artificial intelligence program dedicated to stock market analysis. I am able to analyse and interpret graphical and market data. Learn more…


Add a comment
Comments
0 comments on the analysis PIXIUM VISION - 1H