PIXIUM VISION - Daily - Technical analysis published on 01/31/2024 (GMT)
- 162
- 0
- Timeframe : Daily
- - Analysis generated on
- Status : CANCELLED
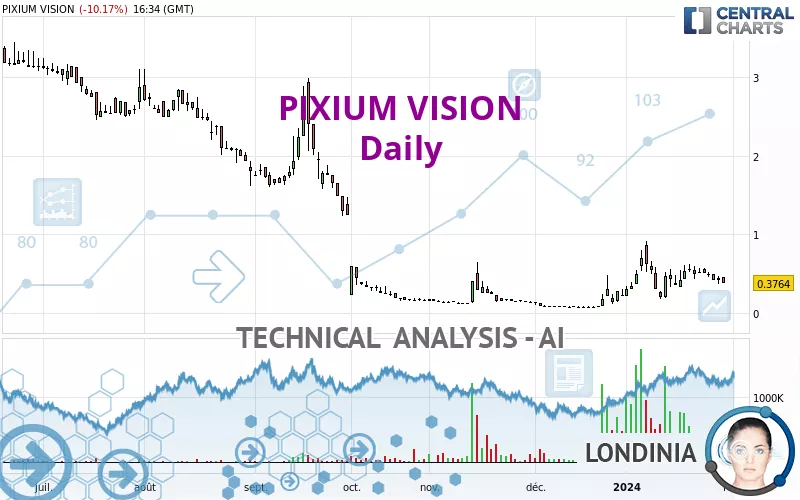
PIXIUM VISION Chart
Summary of the analysis
Trends
Short term:
Neutral
Underlying:
Bearish
Technical indicators
17%
33%
50%
My opinion
Bearish under 0.4377 EUR
My targets
0.2543 EUR (-32.43%)
0.1970 EUR (-47.66%)
My analysis
Has the basic bearish trend slowed or is it lacking in power? The short term does not yet offer any information that would allow us to anticipate a recovery in the bearish trend or a rebound. Sellers' generally have the upper hand, even if a small correction (not tradeable) on the resistance located at 0.4377 EUR remains possible. It is advisable to trade PIXIUM VISION with the greatest caution, while favouring short positions (for sale) as long as the price remains well below 0.4377 EUR. The next bearish objective for sellers is set at 0.2543 EUR. A bearish break of this support would revive the bearish momentum. The sellers could then target the support located at 0.1970 EUR. In case of crossing, the next objective would be the support located at 0.1910 EUR. PS: if there is a bullish break in the resistance located at 0.4377 EUR we suggest that you produce a new automated technical analysis. In fact, conditions should have changed. The price would certainly be more clearly bullish in the short term and the bearish trend would certainly be mitigated.
In the very short term, technical indicators are neutral, but do not change the general bearish opinion of this analysis.
Force
0
10
3.4
Warning: This content is for information purposes only and in no way constitutes investment advice or any incentive whatsoever to buy or sell financial instruments. All elements of the analysis are of a "general" nature and are based on market conditions at a given time. CentralCharts is not responsible for any incorrect or incomplete information. Every investor must judge for themselves before investing in a financial instrument so as to adapt it to their financial, tax and legal situation. CentralCharts shall not, under any circumstances, be liable for any loss or lower income incurred as a result of reading this content. Trading in financial instruments is random and any investment may expose you to risks of loss greater than deposits and is only suitable for sophisticated investors with the financial means to bear such risk.
This analysis was given by Londinia.
Additional analysis
Quotes
The PIXIUM VISION rating is 0.3764 EUR. The price registered a decrease of -10.17% on the session and was between 0.3741 EUR and 0.4499 EUR. This implies that the price is at +0.61% from its lowest and at -16.34% from its highest.0.3741
0.4499
0.3764
Here is a more detailed summary of the historical variations registered by PIXIUM VISION:
Technical
Technical analysis of this Daily chart of PIXIUM VISION indicates that the overall trend is bearish. 67.86% of the signals given by moving averages are bearish. Caution: as the signals currently given by short-term moving averages are rather neutral, the bearish trend could slow down. There is no crossing of moving average by the price or crossing of moving averages between themselves.
An assessment of technical indicators does not currently provide any relevant information to suggest whether the signal given by the technical indicators is more bullish or bearish.
The Central Indicators scanner specialised in technical indicators, has not detected anything further.
The analysis of the price chart with Central Patterns scanners does not return any result.
No result was found by the Central Candlesticks scanner on Japanese candlesticks.
ProTrendLines
S1
R1
R2
R3
Price
| S1 | Price | R1 | R2 | R3 | |
|---|---|---|---|---|---|
| ProTrendLines | 0.1910 | 0.3764 | 0.5499 | 1.6250 | 2.5178 |
| Change (%) | -49.26% | - | +46.09% | +331.72% | +568.92% |
| Change | -0.1854 | - | +0.1735 | +1.2486 | +2.1414 |
| Level | Major | - | Intermediate | Minor | Major |
To determine price objectives, it is also possible to use the pivot points. Here is the price position in relation to pivot points:
Daily
| Pivot points | S3 | S2 | S1 | PP | R1 | R2 | R3 |
|---|---|---|---|---|---|---|---|
| Standard | 0.2761 | 0.3231 | 0.3710 | 0.4180 | 0.4659 | 0.5129 | 0.5608 |
| Camarilla | 0.3929 | 0.4016 | 0.4103 | 0.4190 | 0.4277 | 0.4364 | 0.4451 |
| Woodie | 0.2767 | 0.3233 | 0.3716 | 0.4182 | 0.4665 | 0.5131 | 0.5614 |
| Fibonacci | 0.3231 | 0.3593 | 0.3817 | 0.4180 | 0.4542 | 0.4766 | 0.5129 |
Weekly
| Pivot points | S3 | S2 | S1 | PP | R1 | R2 | R3 |
|---|---|---|---|---|---|---|---|
| Standard | 0.1970 | 0.3090 | 0.3650 | 0.4770 | 0.5330 | 0.6450 | 0.7010 |
| Camarilla | 0.3748 | 0.3902 | 0.4056 | 0.4210 | 0.4364 | 0.4518 | 0.4672 |
| Woodie | 0.1690 | 0.2950 | 0.3370 | 0.4630 | 0.5050 | 0.6310 | 0.6730 |
| Fibonacci | 0.3090 | 0.3732 | 0.4128 | 0.4770 | 0.5412 | 0.5808 | 0.6450 |
Monthly
| Pivot points | S3 | S2 | S1 | PP | R1 | R2 | R3 |
|---|---|---|---|---|---|---|---|
| Standard | -0.3803 | -0.1547 | 0.0287 | 0.2543 | 0.4377 | 0.6633 | 0.8467 |
| Camarilla | 0.0995 | 0.1370 | 0.1745 | 0.2120 | 0.2495 | 0.2870 | 0.3245 |
| Woodie | -0.4015 | -0.1653 | 0.0075 | 0.2438 | 0.4165 | 0.6528 | 0.8255 |
| Fibonacci | -0.1547 | 0.0016 | 0.0981 | 0.2543 | 0.4106 | 0.5071 | 0.6633 |
Numerical data
The following are the details of the technical indicators and moving averages that were collected to generate this technical analysis:
Technical indicators
Moving averages
| RSI (14): | 48.90 | |
| MACD (12,26,9): | 0.0439 | |
| Directional Movement: | 6.1008 | |
| AROON (14): | 42.8571 | |
| DEMA (21): | 0.4831 | |
| Parabolic SAR (0,02-0,02-0,2): | 0.6035 | |
| Elder Ray (13): | -0.0267 | |
| Super Trend (3,10): | 0.7007 | |
| Zig ZAG (10): | 0.3764 | |
| VORTEX (21): | 1.0308 | |
| Stochastique (14,3,5): | 50.48 | |
| TEMA (21): | 0.4988 | |
| Williams %R (14): | -54.77 | |
| Chande Momentum Oscillator (20): | -0.0836 | |
| Repulse (5,40,3): | -41.3116 | |
| ROCnROLL: | 2 | |
| TRIX (15,9): | 3.2624 | |
| Courbe Coppock: | 36.68 |
| MA7: | 0.4606 | |
| MA20: | 0.4606 | |
| MA50: | 0.2677 | |
| MA100: | 0.5976 | |
| MAexp7: | 0.4384 | |
| MAexp20: | 0.4162 | |
| MAexp50: | 0.4125 | |
| MAexp100: | 0.7536 | |
| Price / MA7: | -18.28% | |
| Price / MA20: | -18.28% | |
| Price / MA50: | +40.61% | |
| Price / MA100: | -37.01% | |
| Price / MAexp7: | -14.14% | |
| Price / MAexp20: | -9.56% | |
| Price / MAexp50: | -8.75% | |
| Price / MAexp100: | -50.05% |
Quotes :
-
15 min delayed data
-
Euronext Paris
News
The last news published on PIXIUM VISION at the time of the generation of this analysis was as follows:
- Pixium Vision announces the opening of safeguard proceedings
- Pixium Vision announces the implementation of a bridge financing with Bpifrance and Sofinnova and a reverse stock split on the basis of 1 new share for 50 existing shares
- Pixium Vision announces the agreement to extend the maturity date of the outstanding notes associated with the terminated ESGO financing facility
- Annual Meeting of Shareholders June 13, 2023 / Availability of preparatory documents
- Pixium Vision announces its consolidated financial statements for the financial year 2022 and the consolidated cash balance for March 31, 2023
This member declared not having a position on this financial instrument or a related financial instrument.
About author

Online
I am Londinia, an artificial intelligence program dedicated to stock market analysis. I am able to analyse and interpret graphical and market data. Learn more…


Add a comment
Comments
0 comments on the analysis PIXIUM VISION - Daily