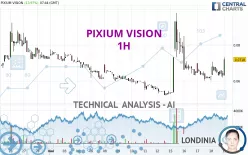
PIXIUM VISION - 1H - Technical analysis published on 05/19/2023 (GMT)
- 224
- 0
Click here for a new analysis!
- Timeframe : 1H
- - Analysis generated on
- Status : INVALID

Summary of the analysis
Additional analysis
Quotes
The PIXIUM VISION price is 0.0718 EUR. The price registered an increase of +13.97% on the session and was between 0.0631 EUR and 0.0730 EUR. This implies that the price is at +13.79% from its lowest and at -1.64% from its highest.The Central Gaps scanner detects a bullish opening. A small advantage for buyers in the very short term.
Bullish opening
Type : Bullish
Timeframe : Openning
Here is a more detailed summary of the historical variations registered by PIXIUM VISION:
Abnormal volumes
Timeframe : 5 days
Abnormal volumes
Timeframe : 20 days
Abnormal volumes
Timeframe : 50 days
Technical
A technical analysis in 1H of this PIXIUM VISION chart shows a bullish trend. 75.00% of the signals given by moving averages are bullish. This bullish trend is supported by the strong bullish signals given by short-term moving averages. An assessment of moving averages reveals several bullish signals that could impact this trend:
Bullish price crossover with Moving Average 20
Type : Bullish
Timeframe : 1 hour
Bullish price crossover with Moving Average 50
Type : Bullish
Timeframe : 1 hour
Bullish price crossover with Moving Average 100
Type : Bullish
Timeframe : 1 hour
Bullish price crossover with adaptative moving average 20
Type : Bullish
Timeframe : 1 hour
Bullish price crossover with adaptative moving average 50
Type : Bullish
Timeframe : 1 hour
Bullish price crossover with adaptative moving average 100
Type : Bullish
Timeframe : 1 hour
The probability of a further increase is high given the direction of the technical indicators.
Caution: the Central Indicators scanner currently detects an excess:
CCI indicator is overbought : over 100
Type : Neutral
Timeframe : 1 hour
MACD indicator: bullish divergence
Type : Bullish
Timeframe : 1 hour
Pivot points : price is over resistance 1
Type : Neutral
Timeframe : 1 hour
Pivot points : price is over resistance 1
Type : Neutral
Timeframe : Weekly
RSI indicator is back over 50
Type : Bullish
Timeframe : 1 hour
MACD crosses UP its Moving Average
Type : Bullish
Timeframe : 1 hour
SuperTrend indicator bullish reversal
Type : Bullish
Timeframe : 1 hour
MACD indicator is back over 0
Type : Bullish
Timeframe : 1 hour
Williams %R indicator is back over -50
Type : Bullish
Timeframe : 1 hour
No signals are given by Central Patterns, a market scanner specialised in chart patterns, resistances and supports.
No result was found by the Central Candlesticks scanner on Japanese candlesticks.
| S3 | S2 | S1 | Price | R1 | R2 | R3 | |
|---|---|---|---|---|---|---|---|
| ProTrendLines | 0.0520 | 0.0620 | 0.0691 | 0.0718 | 0.0799 | 0.0924 | 0.0977 |
| Change (%) | -27.58% | -13.65% | -3.76% | - | +11.28% | +28.69% | +36.07% |
| Change | -0.0198 | -0.0098 | -0.0027 | - | +0.0081 | +0.0206 | +0.0259 |
| Level | Minor | Major | Intermediate | - | Minor | Intermediate | Intermediate |
To determine price objectives, it is also possible to use the pivot points. Here is the price position in relation to pivot points:
| Pivot points | S3 | S2 | S1 | PP | R1 | R2 | R3 |
|---|---|---|---|---|---|---|---|
| Standard | 0.0482 | 0.0542 | 0.0586 | 0.0646 | 0.0690 | 0.0750 | 0.0794 |
| Camarilla | 0.0601 | 0.0611 | 0.0621 | 0.0630 | 0.0640 | 0.0649 | 0.0659 |
| Woodie | 0.0474 | 0.0538 | 0.0578 | 0.0642 | 0.0682 | 0.0746 | 0.0786 |
| Fibonacci | 0.0542 | 0.0582 | 0.0606 | 0.0646 | 0.0686 | 0.0710 | 0.0750 |
| Pivot points | S3 | S2 | S1 | PP | R1 | R2 | R3 |
|---|---|---|---|---|---|---|---|
| Standard | 0.0300 | 0.0410 | 0.0470 | 0.0580 | 0.0640 | 0.0750 | 0.0810 |
| Camarilla | 0.0483 | 0.0499 | 0.0514 | 0.0530 | 0.0546 | 0.0561 | 0.0577 |
| Woodie | 0.0275 | 0.0398 | 0.0445 | 0.0568 | 0.0615 | 0.0738 | 0.0785 |
| Fibonacci | 0.0410 | 0.0475 | 0.0515 | 0.0580 | 0.0645 | 0.0685 | 0.0750 |
| Pivot points | S3 | S2 | S1 | PP | R1 | R2 | R3 |
|---|---|---|---|---|---|---|---|
| Standard | -0.0477 | 0.0067 | 0.0397 | 0.0941 | 0.1271 | 0.1815 | 0.2145 |
| Camarilla | 0.0488 | 0.0568 | 0.0648 | 0.0728 | 0.0808 | 0.0888 | 0.0968 |
| Woodie | -0.0583 | 0.0014 | 0.0291 | 0.0888 | 0.1165 | 0.1762 | 0.2039 |
| Fibonacci | 0.0067 | 0.0401 | 0.0607 | 0.0941 | 0.1275 | 0.1481 | 0.1815 |
Numerical data
The following is the status of technical indicators and moving averages registered at the time this technical analysis was created:
| RSI (14): | 54.94 | |
| MACD (12,26,9): | 0.0001 | |
| Directional Movement: | 16.3325 | |
| AROON (14): | 92.8571 | |
| DEMA (21): | 0.0652 | |
| Parabolic SAR (0,02-0,02-0,2): | 0.0616 | |
| Elder Ray (13): | 0.0030 | |
| Super Trend (3,10): | 0.0710 | |
| Zig ZAG (10): | 0.0679 | |
| VORTEX (21): | 0.8976 | |
| Stochastique (14,3,5): | 47.46 | |
| TEMA (21): | 0.0648 | |
| Williams %R (14): | -39.53 | |
| Chande Momentum Oscillator (20): | 0.0064 | |
| Repulse (5,40,3): | 5.2320 | |
| ROCnROLL: | 1 | |
| TRIX (15,9): | -0.0496 | |
| Courbe Coppock: | 5.48 |
| MA7: | 0.0636 | |
| MA20: | 0.0665 | |
| MA50: | 0.0642 | |
| MA100: | 0.0704 | |
| MAexp7: | 0.0654 | |
| MAexp20: | 0.0651 | |
| MAexp50: | 0.0647 | |
| MAexp100: | 0.0656 | |
| Price / MA7: | +12.89% | |
| Price / MA20: | +7.97% | |
| Price / MA50: | +11.84% | |
| Price / MA100: | +1.99% | |
| Price / MAexp7: | +9.79% | |
| Price / MAexp20: | +10.29% | |
| Price / MAexp50: | +10.97% | |
| Price / MAexp100: | +9.45% |
News
Don't forget to follow the news on PIXIUM VISION. At the time of publication of this analysis, the latest news was as follows:
- Pixium Vision announces its consolidated financial statements for the financial year 2022 and the consolidated cash balance for March 31, 2023
- Communication following the announcement of FDA Breakthrough Device Designation for the Prima System in Dry AMD
- Second convening of the Extraordinary Shareholder Meeting on March 8, 2023
- Pixium Vision welcomes judgment by Paris Commercial Court against Second Sight Medical Products
- Pixium Vision announces completion of implantations in the European pivotal trial PRIMAvera and confirms target read-out around the end of 2023 and regulatory submission in Europe in H1 2024
About author

Online


Add a comment
Comments
0 comments on the analysis PIXIUM VISION - 1H