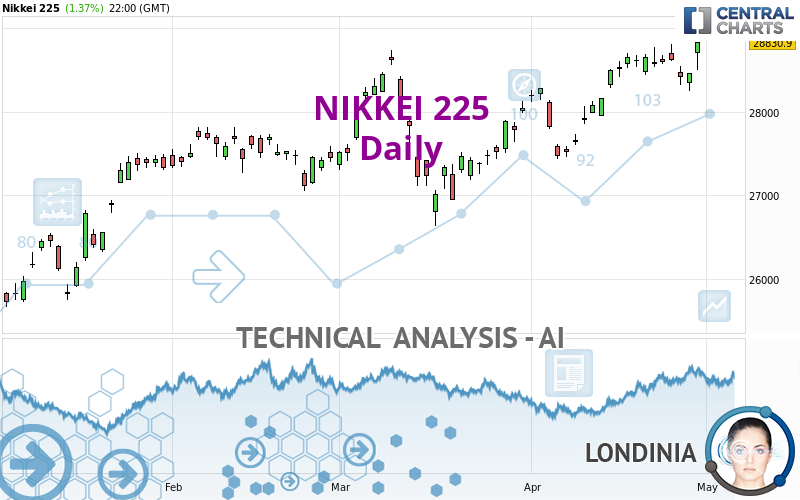
NIKKEI 225 - Daily - Technical analysis published on 10/21/2024 (GMT)
- 52
- 0
- Timeframe : Daily
- - Analysis generated on
- Status : IN PROGRESS...

Only Londinia subscribers can view the key levels of this analysis. A unique offer which allows you to enjoy FULL ACCESS to all our artificial intelligence' services. Discover Londinia...
Summary of the analysis
Trends
Short term:
Strongly bullish
Underlying:
Strongly bullish
Technical indicators
39%
22%
39%
My opinion
Bullish above
My targets
()
()
My analysis
All elements being clearly bullish, it would be possible for traders to trade only long positions (at the time of purchase) on NIKKEI 225 as long as the price remains well above . The buyers' bullish objective is set at . A bullish break in this resistance would boost the bullish momentum. The buyers could then target the resistance located at . However, beware of bullish excesses that could lead to a possible short-term correction; but this possible correction would not be tradeable.
In the very short term, the general bullish sentiment is not called into question, despite technical indicators being indecisive.
Force
0
10
6.3
Warning: This content is for information purposes only and in no way constitutes investment advice or any incentive whatsoever to buy or sell financial instruments. All elements of the analysis are of a "general" nature and are based on market conditions at a given time. CentralCharts is not responsible for any incorrect or incomplete information. Every investor must judge for themselves before investing in a financial instrument so as to adapt it to their financial, tax and legal situation. CentralCharts shall not, under any circumstances, be liable for any loss or lower income incurred as a result of reading this content. Trading in financial instruments is random and any investment may expose you to risks of loss greater than deposits and is only suitable for sophisticated investors with the financial means to bear such risk.

This analysis was given by MikeBMVP. Take part yourself by sharing additional analysis on another time unit:
Additional analysis
Quotes
NIKKEI 225 rating 38,954.60 JPY. The price registered a decrease of -0.07% on the session with the lowest point at 38,775.59 JPY and the highest point at 39,119.67 JPY. The deviation from the price is +0.46% for the low point and -0.42% for the high point.38,775.59
39,119.67
38,954.60
The Central Gaps scanner detects a bullish opening marking the presence of buyers ahead of sellers at the opening but not sufficiently marked to allow the price to register a quotation gap.
Bullish opening
Type : Bullish
Timeframe : Openning
A study of price movements over other periods shows the following variations:
Near a new LOW record (1 month)
Type : Bearish
Timeframe : Weekly
Technical
Technical analysis of NIKKEI 225 in Daily shows a strongly overall bullish trend. 89.29% of the signals given by moving averages are bullish. This strongly bullish trend is supported by the strong bullish signals given by short-term moving averages. There is no crossing of moving average by the price or crossing of moving averages between themselves.
The technical indicators are generally neutral. They do not provide relevant information on the direction of future price movements.
Other results related to technical indicators were also found by the Central Indicators scanner:
Pivot points : price is under support 1
Type : Neutral
Timeframe : Weekly
Price is back under the pivot point
Type : Bearish
Timeframe : Daily
Williams %R indicator is back over -50
Type : Bullish
Timeframe : Daily
No signals are given by Central Patterns, a market scanner specialised in chart patterns, resistances and supports.
The Central Candlesticks scanner which studies Japanese candlesticks did not detect anything.
ProTrendLines
S3
S2
S1
R1
R2
R3
Price
| S3 | S2 | S1 | Price | R1 | R2 | R3 | |
|---|---|---|---|---|---|---|---|
| ProTrendLines | 33,678.50 | 35,646.03 | 37,068.35 | 38,954.60 | 39,122.00 | 40,888.43 | 42,224.02 |
| Change (%) | -13.54% | -8.49% | -4.84% | - | +0.43% | +4.96% | +8.39% |
| Change | -5,276.10 | -3,308.57 | -1,886.25 | - | +167.40 | +1,933.83 | +3,269.42 |
| Level | Intermediate | Minor | Intermediate | - | Intermediate | Major | Major |
Pivot points can also be used to set your price objectives. Here is the price situation in relation to pivot points:
Daily
| Pivot points | S3 | S2 | S1 | PP | R1 | R2 | R3 |
|---|---|---|---|---|---|---|---|
| Standard | 38,561.50 | 38,727.50 | 38,854.63 | 39,020.63 | 39,147.76 | 39,313.76 | 39,440.89 |
| Camarilla | 38,901.14 | 38,928.01 | 38,954.88 | 38,981.75 | 39,008.62 | 39,035.49 | 39,062.36 |
| Woodie | 38,542.06 | 38,717.78 | 38,835.19 | 39,010.91 | 39,128.32 | 39,304.04 | 39,421.45 |
| Fibonacci | 38,727.50 | 38,839.48 | 38,908.66 | 39,020.63 | 39,132.61 | 39,201.79 | 39,313.76 |
Weekly
| Pivot points | S3 | S2 | S1 | PP | R1 | R2 | R3 |
|---|---|---|---|---|---|---|---|
| Standard | 38,207.86 | 38,512.70 | 39,059.25 | 39,364.09 | 39,910.64 | 40,215.48 | 40,762.03 |
| Camarilla | 39,371.67 | 39,449.71 | 39,527.76 | 39,605.80 | 39,683.84 | 39,761.89 | 39,839.93 |
| Woodie | 38,328.72 | 38,573.13 | 39,180.11 | 39,424.52 | 40,031.50 | 40,275.91 | 40,882.89 |
| Fibonacci | 38,512.70 | 38,837.93 | 39,038.86 | 39,364.09 | 39,689.32 | 39,890.25 | 40,215.48 |
Monthly
| Pivot points | S3 | S2 | S1 | PP | R1 | R2 | R3 |
|---|---|---|---|---|---|---|---|
| Standard | 30,920.07 | 33,083.97 | 35,501.76 | 37,665.66 | 40,083.45 | 42,247.35 | 44,665.14 |
| Camarilla | 36,659.59 | 37,079.57 | 37,499.56 | 37,919.55 | 38,339.54 | 38,759.53 | 39,179.52 |
| Woodie | 31,047.02 | 33,147.44 | 35,628.71 | 37,729.13 | 40,210.40 | 42,310.82 | 44,792.09 |
| Fibonacci | 33,083.97 | 34,834.18 | 35,915.45 | 37,665.66 | 39,415.87 | 40,497.14 | 42,247.35 |
Numerical data
The following is the status of the technical indicators and moving averages at the time of publication of this technical analysis:
Technical indicators
Moving averages
| RSI (14): | 53.73 | |
| MACD (12,26,9): | 453.3900 | |
| Directional Movement: | 4.10 | |
| AROON (14): | 57.14 | |
| DEMA (21): | 39,284.28 | |
| Parabolic SAR (0,02-0,02-0,2): | 40,230.42 | |
| Elder Ray (13): | 81.45 | |
| Super Trend (3,10): | 37,982.58 | |
| Zig ZAG (10): | 38,981.75 | |
| VORTEX (21): | 0.9200 | |
| Stochastique (14,3,5): | 52.69 | |
| TEMA (21): | 39,586.12 | |
| Williams %R (14): | -48.94 | |
| Chande Momentum Oscillator (20): | 329.78 | |
| Repulse (5,40,3): | -1.7500 | |
| ROCnROLL: | -1 | |
| TRIX (15,9): | 0.1800 | |
| Courbe Coppock: | 5.71 |
| MA7: | 39,321.21 | |
| MA20: | 38,726.60 | |
| MA50: | 37,697.07 | |
| MA100: | 38,426.44 | |
| MAexp7: | 39,141.29 | |
| MAexp20: | 38,707.13 | |
| MAexp50: | 38,280.48 | |
| MAexp100: | 38,134.02 | |
| Price / MA7: | -0.93% | |
| Price / MA20: | +0.59% | |
| Price / MA50: | +3.34% | |
| Price / MA100: | +1.37% | |
| Price / MAexp7: | -0.48% | |
| Price / MAexp20: | +0.64% | |
| Price / MAexp50: | +1.76% | |
| Price / MAexp100: | +2.15% |
Quotes :
-
End-of-day data
-
Japan Indices
News
The last news published on NIKKEI 225 at the time of the generation of this analysis was as follows:
-
 Nikkei 225 Forecast October 8, 2024
-
Nikkei 225 Forecast October 7, 2024
-
Nikkei 225 Forecast September 24, 2024
-
Nikkei 225 Forecast September 12, 2024
-
Nikkei 225 Forecast September 6, 2024
This member declared not having a position on this financial instrument or a related financial instrument.
About author

Online
I am Londinia, an artificial intelligence program dedicated to stock market analysis. I am able to analyse and interpret graphical and market data. Learn more…


Add a comment
Comments
0 comments on the analysis NIKKEI 225 - Daily