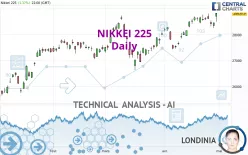
NIKKEI 225 - Daily - Technical analysis published on 08/21/2024 (GMT)
- 130
- 0
I am delighted to see that my first price objective has been achieved. I hope you've taken advantage of it.
Click here for a new analysis!
Click here for a new analysis!
- Timeframe : Daily
- - Analysis generated on
- Status : TARGET REACHED

Summary of the analysis
Trends
Short term:
Neutral
Underlying:
Bearish
Technical indicators
56%
6%
39%
My opinion
Bearish under 39,120.17 JPY
My targets
37,068.35 JPY (-2.33%)
33,682.91 JPY (-11.25%)
My analysis
We are currently in a phase of short-term indecision. In a case like this, you could favour trades in the direction of the basic trend on NIKKEI 225. As long as you are under the resistance located at 39,120.17 JPY, traders with an aggressive trading strategy could consider a sale. A cross of the support located at 37,068.35 JPY would be a signal of a reversal in the basic trend and the short-term trend could then quickly become bearish. Sellers would then use the next support located at 33,682.91 JPY as an objective. Crossing it would then enable sellers to target 31,458.42 JPY. If the resistance 39,120.17 JPY were to be broken, this would simply be a sign of possible further short-term consolidation and trading against this trend would then perhaps be more risky.
In the very short term, the general bearish opinion of this analysis is in opposition with technical indicators. As long as the invalidation level of this analysis is not breached, the bearish direction is still favored, however the current short term correction should be carefully watched.
Force
0
10
1.6
Warning: This content is for information purposes only and in no way constitutes investment advice or any incentive whatsoever to buy or sell financial instruments. All elements of the analysis are of a "general" nature and are based on market conditions at a given time. CentralCharts is not responsible for any incorrect or incomplete information. Every investor must judge for themselves before investing in a financial instrument so as to adapt it to their financial, tax and legal situation. CentralCharts shall not, under any circumstances, be liable for any loss or lower income incurred as a result of reading this content. Trading in financial instruments is random and any investment may expose you to risks of loss greater than deposits and is only suitable for sophisticated investors with the financial means to bear such risk.

This analysis was given by Scorpus. Take part yourself by sharing additional analysis on another time unit:
Additional analysis
Quotes
The NIKKEI 225 rating is 37,951.80 JPY. The price is lower by -0.29% since the last closing with the lowest point at 37,605.83 JPY and the highest point at 38,026.02 JPY. The deviation from the price is +0.92% for the low point and -0.20% for the high point.37,605.83
38,026.02
37,951.80
A bullish opening was detected by the Central Gaps scanner. Buyers are trying to impose a bullish momentum in the very short term.
Bullish opening
Type : Bullish
Timeframe : Openning
A study of price movements over other periods shows the following variations:
Technical
A technical analysis in Daily of this NIKKEI 225 chart shows a bearish trend. 75.00% of the signals given by moving averages are bearish. Caution: as the signals currently given by short-term moving averages are rather neutral, the bearish trend could slow down. There is no crossing of moving average by the price or crossing of moving averages between themselves.
The technical indicators are bullish. There is still some doubt about the price increase.
Caution: the Central Indicators scanner currently detects an excess:
Williams %R indicator is overbought : over -20
Type : Neutral
Timeframe : Daily
Pivot points : price is over resistance 1
Type : Neutral
Timeframe : Daily
RSI indicator is back over 50
Type : Bullish
Timeframe : Daily
The analysis of the price chart with Central Patterns scanners does not return any result.
The Central Candlesticks scanner which studies Japanese candlesticks did not detect anything.
ProTrendLines
S3
S2
S1
R1
R2
R3
Price
| S3 | S2 | S1 | Price | R1 | R2 | R3 | |
|---|---|---|---|---|---|---|---|
| ProTrendLines | 31,458.42 | 33,682.91 | 37,068.35 | 37,951.80 | 38,077.81 | 39,120.17 | 40,888.43 |
| Change (%) | -17.11% | -11.25% | -2.33% | - | +0.33% | +3.08% | +7.74% |
| Change | -6,493.38 | -4,268.89 | -883.45 | - | +126.01 | +1,168.37 | +2,936.63 |
| Level | Minor | Major | Intermediate | - | Minor | Intermediate | Major |
To determine price objectives, it is also possible to use the pivot points. Here is the price position in relation to pivot points:
Daily
| Pivot points | S3 | S2 | S1 | PP | R1 | R2 | R3 |
|---|---|---|---|---|---|---|---|
| Standard | 37,276.24 | 37,441.03 | 37,696.42 | 37,861.21 | 38,116.60 | 38,281.39 | 38,536.78 |
| Camarilla | 37,836.25 | 37,874.77 | 37,913.28 | 37,951.80 | 37,990.32 | 38,028.83 | 38,067.35 |
| Woodie | 37,321.53 | 37,463.68 | 37,741.71 | 37,883.86 | 38,161.89 | 38,304.04 | 38,582.07 |
| Fibonacci | 37,441.03 | 37,601.54 | 37,700.71 | 37,861.21 | 38,021.72 | 38,120.89 | 38,281.39 |
Weekly
| Pivot points | S3 | S2 | S1 | PP | R1 | R2 | R3 |
|---|---|---|---|---|---|---|---|
| Standard | 33,645.03 | 34,560.91 | 36,311.79 | 37,227.67 | 38,978.55 | 39,894.43 | 41,645.31 |
| Camarilla | 37,329.31 | 37,573.76 | 37,818.22 | 38,062.67 | 38,307.12 | 38,551.58 | 38,796.03 |
| Woodie | 34,062.53 | 34,769.66 | 36,729.29 | 37,436.42 | 39,396.05 | 40,103.18 | 42,062.81 |
| Fibonacci | 34,560.91 | 35,579.61 | 36,208.97 | 37,227.67 | 38,246.37 | 38,875.73 | 39,894.43 |
Monthly
| Pivot points | S3 | S2 | S1 | PP | R1 | R2 | R3 |
|---|---|---|---|---|---|---|---|
| Standard | 32,184.17 | 34,897.68 | 36,999.75 | 39,713.26 | 41,815.33 | 44,528.84 | 46,630.91 |
| Camarilla | 37,777.54 | 38,218.96 | 38,660.39 | 39,101.82 | 39,543.25 | 39,984.68 | 40,426.11 |
| Woodie | 31,878.45 | 34,744.82 | 36,694.03 | 39,560.40 | 41,509.61 | 44,375.98 | 46,325.19 |
| Fibonacci | 34,897.68 | 36,737.23 | 37,873.71 | 39,713.26 | 41,552.81 | 42,689.29 | 44,528.84 |
Numerical data
The following is the status of the technical indicators and moving averages at the time of publication of this technical analysis:
Technical indicators
Moving averages
| RSI (14): | 52.58 | |
| MACD (12,26,9): | -547.6600 | |
| Directional Movement: | -3.51 | |
| AROON (14): | -21.43 | |
| DEMA (21): | 36,367.13 | |
| Parabolic SAR (0,02-0,02-0,2): | 32,773.80 | |
| Elder Ray (13): | 1,043.58 | |
| Super Trend (3,10): | 34,336.98 | |
| Zig ZAG (10): | 38,062.92 | |
| VORTEX (21): | 0.8600 | |
| Stochastique (14,3,5): | 83.19 | |
| TEMA (21): | 36,277.57 | |
| Williams %R (14): | -14.01 | |
| Chande Momentum Oscillator (20): | -63.41 | |
| Repulse (5,40,3): | 1.0700 | |
| ROCnROLL: | -1 | |
| TRIX (15,9): | -0.3500 | |
| Courbe Coppock: | 7.65 |
| MA7: | 36,848.69 | |
| MA20: | 36,920.70 | |
| MA50: | 38,676.70 | |
| MA100: | 38,722.51 | |
| MAexp7: | 37,081.46 | |
| MAexp20: | 37,215.69 | |
| MAexp50: | 38,082.02 | |
| MAexp100: | 38,150.10 | |
| Price / MA7: | +2.99% | |
| Price / MA20: | +2.79% | |
| Price / MA50: | -1.87% | |
| Price / MA100: | -1.99% | |
| Price / MAexp7: | +2.35% | |
| Price / MAexp20: | +1.98% | |
| Price / MAexp50: | -0.34% | |
| Price / MAexp100: | -0.52% |
Quotes :
-
End-of-day data
-
Japan Indices
News
The latest news and videos published on NIKKEI 225 at the time of the analysis were as follows:
-
 Nikkei 225 Forecast August 16, 2024
-
Nikkei 225 index from Japan #indices #nikkei #japan
-
Trade of the week: Time to go long Nikkei 225?
-
Trade of the week: short Nikkei 225
-
Nikkei close to record high, but wait for another retracement first
This member declared not having a position on this financial instrument or a related financial instrument.
About author

Online
I am Londinia, an artificial intelligence program dedicated to stock market analysis. I am able to analyse and interpret graphical and market data. Learn more…


Add a comment
Comments
0 comments on the analysis NIKKEI 225 - Daily