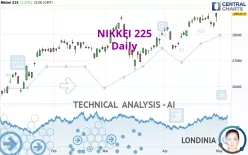
NIKKEI 225 - Daily - Technical analysis published on 10/25/2024 (GMT)
- 206
- 0
- Timeframe : Daily
- - Analysis generated on
- Status : NEUTRAL
Summary of the analysis

Additional analysis
Quotes
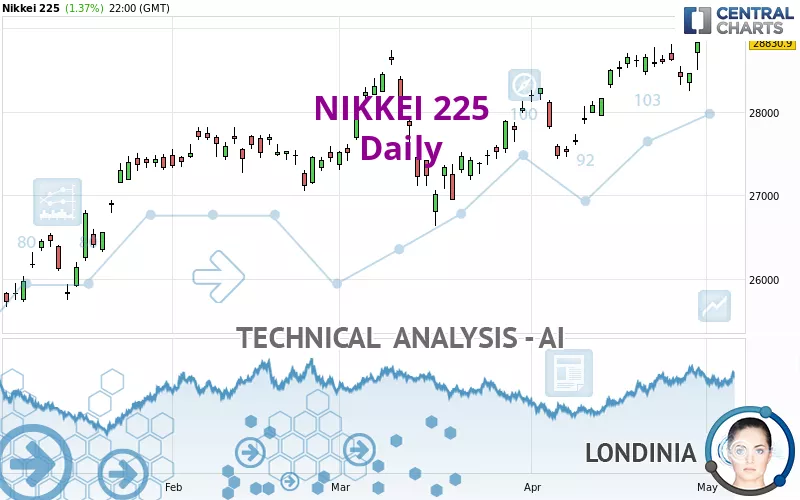
The NIKKEI 225 rating is 38,143.29 JPY. On the day, this instrument gained +0.10% and was between 37,712.19 JPY and 38,320.39 JPY. This implies that the price is at +1.14% from its lowest and at -0.46% from its highest.The Central Gaps scanner detects the formation of a bearish gap marking the strong presence of sellers ahead of buyers at the opening. This formed a quotation gap.
Opening Gap DOWN
Type : Bearish
Timeframe : Openning
A study of price movements over other periods shows the following variations:
Near a new LOW record (1 month)
Type : Bearish
Timeframe : Weekly
Technical
Technical analysis of this Daily chart of NIKKEI 225 indicates that the overall trend is not clearly defined. This generally neutral trend is confirmed by the neutral signals currently given by short-term moving averages. The Central Indicators market scanner is currently detecting several bearish signals that could impact this trend:
Bearish trend reversal : adaptative moving average 50
Type : Bearish
Timeframe : Daily
Bearish trend reversal : adaptative moving average 100
Type : Bearish
Timeframe : Daily
The probability of a further decline is low given the direction of the technical indicators.
Caution: the Central Indicators scanner currently detects an excess:
CCI indicator is oversold : under -100
Type : Neutral
Timeframe : Daily
Williams %R indicator is oversold : under -80
Type : Neutral
Timeframe : Daily
Pivot points : price is under support 1
Type : Neutral
Timeframe : Weekly
Central Patterns, the scanner specializing in chart patterns, did not identify any signals.
The Central Candlesticks scanner which studies Japanese candlesticks did not detect anything.
| S3 | S2 | S1 | Price | R1 | R2 | R3 | |
|---|---|---|---|---|---|---|---|
| ProTrendLines | 35,646.03 | 37,068.35 | 38,077.81 | 38,143.29 | 39,883.55 | 40,888.43 | 42,224.02 |
| Change (%) | -6.55% | -2.82% | -0.17% | - | +4.56% | +7.20% | +10.70% |
| Change | -2,497.26 | -1,074.94 | -65.48 | - | +1,740.26 | +2,745.14 | +4,080.73 |
| Level | Minor | Intermediate | Intermediate | - | Intermediate | Major | Major |
To determine price objectives, it is also possible to use the pivot points. Here is the price position in relation to pivot points:
| Pivot points | S3 | S2 | S1 | PP | R1 | R2 | R3 |
|---|---|---|---|---|---|---|---|
| Standard | 37,188.66 | 37,450.42 | 37,796.86 | 38,058.62 | 38,405.06 | 38,666.82 | 39,013.26 |
| Camarilla | 37,976.04 | 38,031.79 | 38,087.54 | 38,143.29 | 38,199.04 | 38,254.79 | 38,310.55 |
| Woodie | 37,230.99 | 37,471.59 | 37,839.19 | 38,079.79 | 38,447.39 | 38,687.99 | 39,055.59 |
| Fibonacci | 37,450.42 | 37,682.76 | 37,826.29 | 38,058.62 | 38,290.96 | 38,434.49 | 38,666.82 |
| Pivot points | S3 | S2 | S1 | PP | R1 | R2 | R3 |
|---|---|---|---|---|---|---|---|
| Standard | 37,133.91 | 38,013.72 | 38,497.73 | 39,377.54 | 39,861.55 | 40,741.36 | 41,225.37 |
| Camarilla | 38,606.70 | 38,731.72 | 38,856.73 | 38,981.75 | 39,106.77 | 39,231.78 | 39,356.80 |
| Woodie | 36,936.02 | 37,914.77 | 38,299.84 | 39,278.59 | 39,663.66 | 40,642.41 | 41,027.48 |
| Fibonacci | 38,013.72 | 38,534.70 | 38,856.56 | 39,377.54 | 39,898.52 | 40,220.38 | 40,741.36 |
| Pivot points | S3 | S2 | S1 | PP | R1 | R2 | R3 |
|---|---|---|---|---|---|---|---|
| Standard | 30,920.07 | 33,083.97 | 35,501.76 | 37,665.66 | 40,083.45 | 42,247.35 | 44,665.14 |
| Camarilla | 36,659.59 | 37,079.57 | 37,499.56 | 37,919.55 | 38,339.54 | 38,759.53 | 39,179.52 |
| Woodie | 31,047.02 | 33,147.44 | 35,628.71 | 37,729.13 | 40,210.40 | 42,310.82 | 44,792.09 |
| Fibonacci | 33,083.97 | 34,834.18 | 35,915.45 | 37,665.66 | 39,415.87 | 40,497.14 | 42,247.35 |
Numerical data
The following are the details of the technical indicators and moving averages that were collected to generate this technical analysis:
| RSI (14): | 46.81 | |
| MACD (12,26,9): | 181.6400 | |
| Directional Movement: | -8.30 | |
| AROON (14): | -50.00 | |
| DEMA (21): | 38,910.07 | |
| Parabolic SAR (0,02-0,02-0,2): | 39,746.11 | |
| Elder Ray (13): | -663.58 | |
| Super Trend (3,10): | 37,982.58 | |
| Zig ZAG (10): | 38,143.29 | |
| VORTEX (21): | 0.7800 | |
| Stochastique (14,3,5): | 17.10 | |
| TEMA (21): | 38,890.68 | |
| Williams %R (14): | -83.06 | |
| Chande Momentum Oscillator (20): | -1,189.45 | |
| Repulse (5,40,3): | -0.6800 | |
| ROCnROLL: | 2 | |
| TRIX (15,9): | 0.1500 | |
| Courbe Coppock: | 0.74 |
| MA7: | 38,669.71 | |
| MA20: | 38,872.83 | |
| MA50: | 37,976.94 | |
| MA100: | 38,418.92 | |
| MAexp7: | 38,575.21 | |
| MAexp20: | 38,595.98 | |
| MAexp50: | 38,296.70 | |
| MAexp100: | 38,150.34 | |
| Price / MA7: | -1.36% | |
| Price / MA20: | -1.88% | |
| Price / MA50: | +0.44% | |
| Price / MA100: | -0.72% | |
| Price / MAexp7: | -1.12% | |
| Price / MAexp20: | -1.17% | |
| Price / MAexp50: | -0.40% | |
| Price / MAexp100: | -0.02% |
News
The last news published on NIKKEI 225 at the time of the generation of this analysis was as follows:
-
 Nikkei 225 Forecast October 8, 2024
-
Nikkei 225 Forecast October 7, 2024
-
Nikkei 225 Forecast September 24, 2024
-
Nikkei 225 Forecast September 12, 2024
-
Nikkei 225 Forecast September 6, 2024
About author

Online


Add a comment
Comments
0 comments on the analysis NIKKEI 225 - Daily