CAC MID 60 - 1H - Technical analysis published on 04/04/2024 (GMT)
- 141
- 0
Click here for a new analysis!
- Timeframe : 1H
- - Analysis generated on
- Status : INVALID
Summary of the analysis

Additional analysis
Quotes
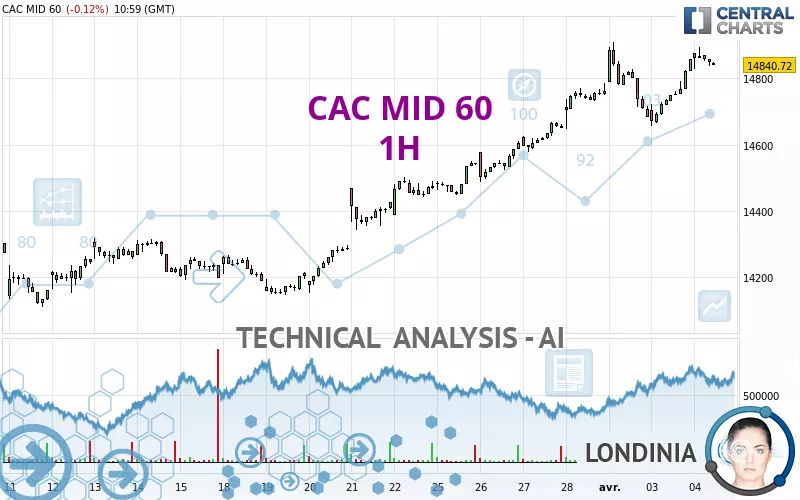
CAC MID 60 rating 14,848.21 EUR. The price registered a decrease of -0.07% on the session and was traded between 14,828.46 EUR and 14,894.17 EUR over the period. The price is currently at +0.13% from its lowest and -0.31% from its highest.The Central Gaps scanner detects a bullish gap which is a sign that buyers have taken the lead in the very short term.
Opening Gap UP
Type : Bullish
Timeframe : Openning
Here is a more detailed summary of the historical variations registered by CAC MID 60:
Near a new HIGH record (1 year)
Type : Bullish
Timeframe : Weekly
Near a new HIGH record (1st january)
Type : Bullish
Timeframe : Weekly
Near a new HIGH record (1 month)
Type : Bullish
Timeframe : Weekly
Technical
Technical analysis of CAC MID 60 in 1H shows a strongly overall bullish trend. The signals given by moving averages are 89.29% bullish. This strongly bullish trend seems to be running out of steam given the signals being given by short-term moving averages. An assessment of moving averages reveals a bearish signal that could impact this trend:
Bearish trend reversal : Moving Average 20
Type : Bearish
Timeframe : 1 hour
Technical indicators are strongly bullish, suggesting that the price increase should continue.
Caution: the Central Indicators scanner currently detects an excess:
MACD indicator: bearish divergence
Type : Bearish
Timeframe : 1 hour
No signals are given by Central Patterns, a market scanner specialised in chart patterns, resistances and supports.
The Central Candlesticks scanner, specialised in Japanese candlesticks, did not identify any signals.
| S3 | S2 | S1 | Price | R1 | R2 | R3 | |
|---|---|---|---|---|---|---|---|
| ProTrendLines | 14,504.05 | 14,656.22 | 14,767.53 | 14,848.21 | 14,909.83 | 15,233.43 | 15,920.10 |
| Change (%) | -2.32% | -1.29% | -0.54% | - | +0.41% | +2.59% | +7.22% |
| Change | -344.16 | -191.99 | -80.68 | - | +61.62 | +385.22 | +1,071.89 |
| Level | Minor | Minor | Major | - | Intermediate | Major | Minor |
Attention could also be paid to pivot points to set price objectives:
| Pivot points | S3 | S2 | S1 | PP | R1 | R2 | R3 |
|---|---|---|---|---|---|---|---|
| Standard | 14,521.00 | 14,588.61 | 14,723.83 | 14,791.44 | 14,926.66 | 14,994.27 | 15,129.49 |
| Camarilla | 14,803.27 | 14,821.87 | 14,840.46 | 14,859.05 | 14,877.64 | 14,896.24 | 14,914.83 |
| Woodie | 14,554.81 | 14,605.51 | 14,757.64 | 14,808.34 | 14,960.47 | 15,011.17 | 15,163.30 |
| Fibonacci | 14,588.61 | 14,666.09 | 14,713.96 | 14,791.44 | 14,868.92 | 14,916.79 | 14,994.27 |
| Pivot points | S3 | S2 | S1 | PP | R1 | R2 | R3 |
|---|---|---|---|---|---|---|---|
| Standard | 14,205.05 | 14,326.45 | 14,544.77 | 14,666.17 | 14,884.49 | 15,005.89 | 15,224.21 |
| Camarilla | 14,669.66 | 14,700.80 | 14,731.94 | 14,763.08 | 14,794.22 | 14,825.36 | 14,856.50 |
| Woodie | 14,253.50 | 14,350.68 | 14,593.22 | 14,690.40 | 14,932.94 | 15,030.12 | 15,272.66 |
| Fibonacci | 14,326.45 | 14,456.23 | 14,536.40 | 14,666.17 | 14,795.95 | 14,876.12 | 15,005.89 |
| Pivot points | S3 | S2 | S1 | PP | R1 | R2 | R3 |
|---|---|---|---|---|---|---|---|
| Standard | 13,485.48 | 13,750.80 | 14,256.94 | 14,522.26 | 15,028.40 | 15,293.72 | 15,799.86 |
| Camarilla | 14,550.93 | 14,621.65 | 14,692.36 | 14,763.08 | 14,833.80 | 14,904.51 | 14,975.23 |
| Woodie | 13,605.89 | 13,811.01 | 14,377.35 | 14,582.47 | 15,148.81 | 15,353.93 | 15,920.27 |
| Fibonacci | 13,750.80 | 14,045.50 | 14,227.56 | 14,522.26 | 14,816.96 | 14,999.02 | 15,293.72 |
Numerical data
The following is the status of technical indicators and moving averages registered at the time this technical analysis was created:
| RSI (14): | 63.18 | |
| MACD (12,26,9): | 41.6900 | |
| Directional Movement: | 18.38 | |
| AROON (14): | 71.42 | |
| DEMA (21): | 14,841.57 | |
| Parabolic SAR (0,02-0,02-0,2): | 14,731.32 | |
| Elder Ray (13): | 38.48 | |
| Super Trend (3,10): | 14,762.75 | |
| Zig ZAG (10): | 14,842.02 | |
| VORTEX (21): | 1.0600 | |
| Stochastique (14,3,5): | 84.18 | |
| TEMA (21): | 14,842.07 | |
| Williams %R (14): | -21.59 | |
| Chande Momentum Oscillator (20): | 173.19 | |
| Repulse (5,40,3): | -0.0300 | |
| ROCnROLL: | 1 | |
| TRIX (15,9): | 0.0300 | |
| Courbe Coppock: | 1.11 |
| MA7: | 14,707.43 | |
| MA20: | 14,414.41 | |
| MA50: | 14,163.58 | |
| MA100: | 13,844.01 | |
| MAexp7: | 14,834.91 | |
| MAexp20: | 14,787.78 | |
| MAexp50: | 14,698.67 | |
| MAexp100: | 14,572.67 | |
| Price / MA7: | +0.96% | |
| Price / MA20: | +3.01% | |
| Price / MA50: | +4.83% | |
| Price / MA100: | +7.25% | |
| Price / MAexp7: | +0.09% | |
| Price / MAexp20: | +0.41% | |
| Price / MAexp50: | +1.02% | |
| Price / MAexp100: | +1.89% |
About author
Online


Add a comment
Comments
0 comments on the analysis CAC MID 60 - 1H