CAC MID 60 overview
CAC MID 60
> Analyses

 Thank you
Reply
Chart
Thank you
Reply
Chart
Londinia
has published a new analysis.
- 0
- 93649
- 15797
- 0
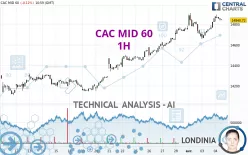
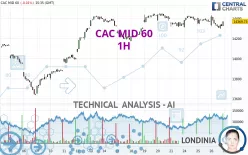
Timeframe : 1H - Simple chart
Status : INVALID
All elements being clearly bullish, it would be possible for traders to trade only long positions (at the time of purchase) on CAC MID 60 as long as the price remains well above 14,767.53 EUR. The…
CAC MID 60
> Analyses
 Thank you
Reply
Chart
Thank you
Reply
Chart
Londinia
has published a new analysis.
- 0
- 93649
- 15797
- 0
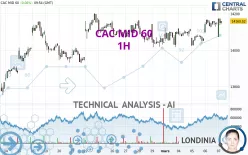
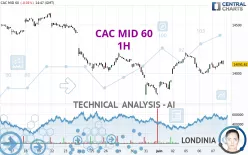
Timeframe : 1H - Simple chart
Status : TARGET REACHED
The bullish trend is currently very strong on CAC MID 60. As long as the price remains above the support at 14,018.43 EUR, you could try to benefit from the boom. The first bullish objective is…
CAC MID 60
> Analyses
 Thank you
Reply
Chart
Thank you
Reply
Chart
Londinia
has published a new analysis.
- 0
- 93649
- 15797
- 0
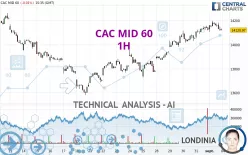
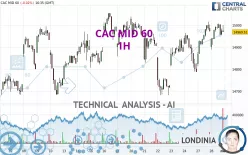
Timeframe : 1H - Simple chart
Status : INVALID
We are currently in a phase of short-term indecision. In a case like this, you could favour trades in the direction of the basic trend on CAC MID 60. As long as you are above the support located at…
CAC MID 60
> Analyses
 Thank you
Reply
Chart
Thank you
Reply
Chart
Londinia
has published a new analysis.
- 0
- 93649
- 15797
- 0
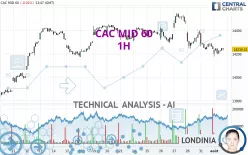
Timeframe : 1H - Simple chart
Status : TARGET REACHED
CAC MID 60 is part of a very strong bearish trend. Traders may consider trading only short positions (for sale) as long as the price remains well below 14,312.50 EUR. The next support located at…
CAC MID 60
> Analyses
 Thank you
Reply
Chart
Thank you
Reply
Chart
Londinia
has published a new analysis.
- 0
- 93649
- 15797
- 0
Timeframe : 1H - Simple chart
Status : NEUTRAL
The neutral short-term trend shows a weakening of the basic, slightly bullish trend on CAC MID 60. It is difficult to advise a trading direction under these conditions. The first resistance is located…
CAC MID 60
> Analyses
 Thank you
Reply
Chart
Thank you
Reply
Chart
Londinia
has published a new analysis.
- 0
- 93649
- 15797
- 0
Timeframe : 1H - Simple chart
Status : NEUTRAL
The basic trend is neutral and the short term is tentatively bullish. With such a pattern, it is difficult to favour buying or selling. The first resistance is located at 14,188.90 EUR. The first…
CAC MID 60
> Analyses
 Thank you
Reply
Chart
Thank you
Reply
Chart
Londinia
has published a new analysis.
- 0
- 93649
- 15797
- 0
Timeframe : 1H - Simple chart
Status : TARGET REACHED
The bullish trend is currently very strong on CAC MID 60. As long as the price remains above the support at 14,792.00 EUR, you could try to benefit from the boom. The first bullish objective is…
CAC MID 60
> Analyses
 Thank you
Reply
Chart
Thank you
Reply
Chart
Londinia
has published a new analysis.
- 0
- 93649
- 15797
- 0
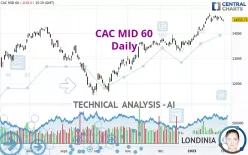
Timeframe : Daily - Simple chart
Status : TARGET REACHED
All elements being clearly bullish, it would be possible for traders to trade only long positions (at the time of purchase) on CAC MID 60 as long as the price remains well above 14,188.90 EUR. The…

