| Open: | - |
| Change: | - |
| Volume: | - |
| Low: | - |
| High: | - |
| High / Low range: | - |
| Type: | Indices |
| Ticker: | CACMD |
| ISIN: | QS0010989117 |
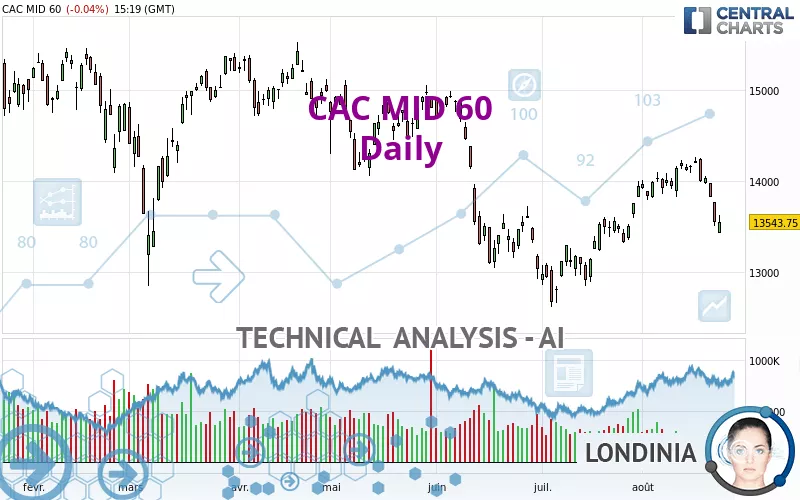
CAC MID 60 - Daily - Technical analysis published on 08/23/2022 (GMT)
- 149
- 0
- 08/23/2022 - 15:35
Click here for a new analysis!
- Timeframe : Daily
- - Analysis generated on 08/23/2022 - 15:35
- Status : TARGET REACHED
Summary of the analysis

Additional analysis
Quotes
The CAC MID 60 rating is 13,543.75 EUR. The price is lower by -0.04% since the last closing with the lowest point at 13,423.19 EUR and the highest point at 13,627.46 EUR. The deviation from the price is +0.90% for the low point and -0.61% for the high point.The Central Gaps scanner detects a bearish gap which is a sign that the sellers have taken the lead in the very short term.
Opening Gap DOWN
Type : Bearish
Timeframe : Openning
Here is a more detailed summary of the historical variations registered by CAC MID 60:
Near a new HIGH record (1 month)
Type : Bullish
Timeframe : Weekly
Technical
Technical analysis of CAC MID 60 in Daily shows an overall bearish trend. 67.86% of the signals given by moving averages are bearish. Caution: as the signals currently given by short-term moving averages are rather neutral, the bearish trend could slow down. The Central Indicators scanner detects a bearish signal on moving averages that could impact this trend:
Bearish price crossover with Moving Average 50
Type : Bearish
Timeframe : Daily
In fact, according to the parameters integrated into the Central Analyzer system, 13 technical indicators out of 18 analysed are currently bearish. Caution: the Central Indicators scanner currently detects an excess:
CCI indicator is oversold : under -100
Type : Neutral
Timeframe : Daily
Williams %R indicator is oversold : under -80
Type : Neutral
Timeframe : Daily
Pivot points : price is under support 3
Type : Neutral
Timeframe : Weekly
The analysis of the price chart with Central Patterns scanners does not return any result.
The Central Candlesticks scanner, specialised in Japanese candlesticks, did not identify any signals.
| S3 | S2 | S1 | Price | R1 | R2 | R3 | |
|---|---|---|---|---|---|---|---|
| ProTrendLines | 11,126.90 | 12,455.10 | 13,098.50 | 13,543.75 | 13,580.10 | 14,188.90 | 14,782.60 |
| Change (%) | -17.84% | -8.04% | -3.29% | - | +0.27% | +4.76% | +9.15% |
| Change | -2,416.85 | -1,088.65 | -445.25 | - | +36.35 | +645.15 | +1,238.85 |
| Level | Intermediate | Major | Minor | - | Major | Major | Intermediate |
Attention could also be paid to pivot points to set price objectives:
| Pivot points | S3 | S2 | S1 | PP | R1 | R2 | R3 |
|---|---|---|---|---|---|---|---|
| Standard | 13,183.85 | 13,345.13 | 13,446.84 | 13,608.12 | 13,709.83 | 13,871.11 | 13,972.82 |
| Camarilla | 13,476.24 | 13,500.35 | 13,524.45 | 13,548.56 | 13,572.67 | 13,596.78 | 13,620.88 |
| Woodie | 13,154.08 | 13,330.24 | 13,417.07 | 13,593.23 | 13,680.06 | 13,856.22 | 13,943.05 |
| Fibonacci | 13,345.13 | 13,445.59 | 13,507.65 | 13,608.12 | 13,708.58 | 13,770.64 | 13,871.11 |
| Pivot points | S3 | S2 | S1 | PP | R1 | R2 | R3 |
|---|---|---|---|---|---|---|---|
| Standard | 13,242.10 | 13,535.58 | 13,682.31 | 13,975.79 | 14,122.52 | 14,416.00 | 14,562.73 |
| Camarilla | 13,707.99 | 13,748.35 | 13,788.70 | 13,829.05 | 13,869.40 | 13,909.76 | 13,950.11 |
| Woodie | 13,168.74 | 13,498.89 | 13,608.95 | 13,939.10 | 14,049.16 | 14,379.31 | 14,489.37 |
| Fibonacci | 13,535.58 | 13,703.74 | 13,807.63 | 13,975.79 | 14,143.95 | 14,247.84 | 14,416.00 |
| Pivot points | S3 | S2 | S1 | PP | R1 | R2 | R3 |
|---|---|---|---|---|---|---|---|
| Standard | 11,649.97 | 12,131.89 | 13,038.85 | 13,520.77 | 14,427.73 | 14,909.65 | 15,816.61 |
| Camarilla | 13,563.88 | 13,691.19 | 13,818.51 | 13,945.82 | 14,073.13 | 14,200.45 | 14,327.76 |
| Woodie | 11,862.50 | 12,238.15 | 13,251.38 | 13,627.03 | 14,640.26 | 15,015.91 | 16,029.14 |
| Fibonacci | 12,131.89 | 12,662.44 | 12,990.22 | 13,520.77 | 14,051.32 | 14,379.10 | 14,909.65 |
Numerical data
The following is the status of the technical indicators and moving averages at the time of publication of this technical analysis:
| RSI (14): | 41.44 | |
| MACD (12,26,9): | 49.6700 | |
| Directional Movement: | -16.04 | |
| AROON (14): | -35.71 | |
| DEMA (21): | 13,932.58 | |
| Parabolic SAR (0,02-0,02-0,2): | 14,173.37 | |
| Elder Ray (13): | -338.15 | |
| Super Trend (3,10): | 14,086.07 | |
| Zig ZAG (10): | 13,541.24 | |
| VORTEX (21): | 0.9300 | |
| Stochastique (14,3,5): | 9.40 | |
| TEMA (21): | 13,953.41 | |
| Williams %R (14): | -85.90 | |
| Chande Momentum Oscillator (20): | -377.36 | |
| Repulse (5,40,3): | -1.4400 | |
| ROCnROLL: | 2 | |
| TRIX (15,9): | 0.1500 | |
| Courbe Coppock: | 0.39 |
| MA7: | 13,905.45 | |
| MA20: | 13,930.75 | |
| MA50: | 13,529.41 | |
| MA100: | 14,138.47 | |
| MAexp7: | 13,807.90 | |
| MAexp20: | 13,838.92 | |
| MAexp50: | 13,821.32 | |
| MAexp100: | 14,052.96 | |
| Price / MA7: | -2.60% | |
| Price / MA20: | -2.78% | |
| Price / MA50: | +0.11% | |
| Price / MA100: | -4.21% | |
| Price / MAexp7: | -1.91% | |
| Price / MAexp20: | -2.13% | |
| Price / MAexp50: | -2.01% | |
| Price / MAexp100: | -3.62% |
About author
Online


Add a comment
Comments
0 comments on the analysis CAC MID 60 - Daily