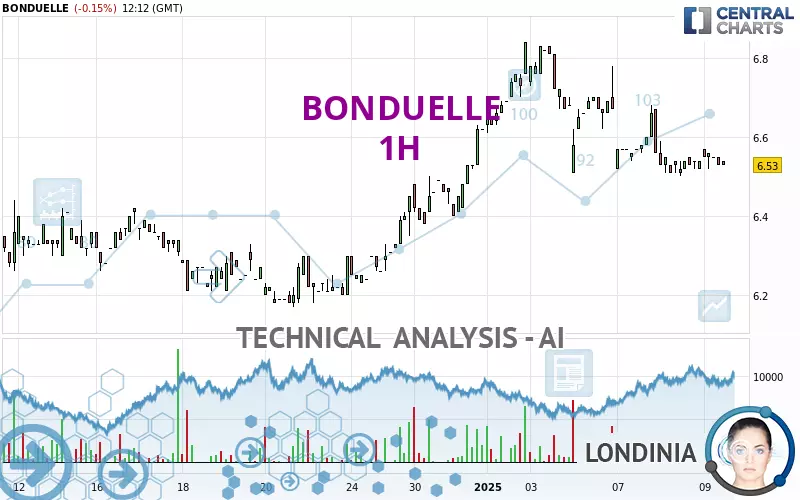
BONDUELLE - 1H - Technical analysis published on 01/09/2025 (GMT)
- 71
- 0
Click here for a new analysis!
- Timeframe : 1H
- - Analysis generated on
- Status : LEVEL MAINTAINED

Summary of the analysis

Additional analysis
Quotes
The BONDUELLE rating is 6.53 EUR. The price is lower by -0.15% since the last closing and was traded between 6.52 EUR and 6.57 EUR over the period. The price is currently at +0.15% from its lowest and -0.61% from its highest.The Central Gaps scanner detects a bullish opening marking the presence of buyers ahead of sellers at the opening but not sufficiently marked to allow the price to register a quotation gap.
Bullish opening
Type : Bullish
Timeframe : Openning
So that you have an overall view of the price change, here is a table showing the variations over several periods:
Near a new LOW record (1st january)
Type : Bearish
Timeframe : Weekly
Near a new HIGH record (1 month)
Type : Bullish
Timeframe : Weekly
Technical
Technical analysis of BONDUELLE in 1H shows an overall bullish trend. 71.43% of the signals given by moving averages are bullish. Caution: the neutral signals currently given by the short-term moving averages indicate that this bullish trend is showing signs of running out of steam. An assessment of moving averages reveals several bearish and bullish signals:
Bearish trend reversal : Moving Average 20
Type : Bearish
Timeframe : 1 hour
Bearish price crossover with adaptative moving average 20
Type : Bearish
Timeframe : 1 hour
Bullish price crossover with adaptative moving average 20
Type : Bullish
Timeframe : 1 hour
In fact, Central Analyzer took into account 18 technical indicators and the result was as follows: 5 are bullish, 9 are neutral and 4 are bearish. Caution: the Central Indicators scanner currently detects an excess:
Williams %R indicator is oversold : under -80
Type : Neutral
Timeframe : 1 hour
RSI indicator is back over 50
Type : Bullish
Timeframe : 1 hour
Price is back over the pivot point
Type : Bullish
Timeframe : Weekly
Price is back under the pivot point
Type : Bearish
Timeframe : 1 hour
An analysis of the price chart with the Central Patterns scanner (detector of chart patterns and resistances and supports) shows several results that can have an impact on the price change:
Near horizontal support
Type : Bullish
Timeframe : 1 hour
Near support of channel
Type : Bullish
Timeframe : 1 hour
From the Japanese candlestick perspective, the Central Candlesticks scanner notes the presence of these results that could impact the short-term trend:
Bullish harami cross
Type : Bullish
Timeframe : 1 hour
Doji
Type : Neutral
Timeframe : 1 hour
| S3 | S2 | S1 | Price | R1 | R2 | R3 | |
|---|---|---|---|---|---|---|---|
| ProTrendLines | 6.31 | 6.45 | 6.53 | 6.53 | 6.68 | 6.85 | 7.07 |
| Change (%) | -3.37% | -1.23% | 0% | - | +2.30% | +4.90% | +8.27% |
| Change | -0.22 | -0.08 | 0 | - | +0.15 | +0.32 | +0.54 |
| Level | Intermediate | Minor | Minor | - | Intermediate | Intermediate | Minor |
Pivot points can also be used to set your price objectives. Here is the price situation in relation to pivot points:
| Pivot points | S3 | S2 | S1 | PP | R1 | R2 | R3 |
|---|---|---|---|---|---|---|---|
| Standard | 6.41 | 6.45 | 6.50 | 6.54 | 6.59 | 6.63 | 6.68 |
| Camarilla | 6.52 | 6.52 | 6.53 | 6.54 | 6.55 | 6.56 | 6.57 |
| Woodie | 6.41 | 6.45 | 6.50 | 6.54 | 6.59 | 6.63 | 6.68 |
| Fibonacci | 6.45 | 6.49 | 6.51 | 6.54 | 6.58 | 6.60 | 6.63 |
| Pivot points | S3 | S2 | S1 | PP | R1 | R2 | R3 |
|---|---|---|---|---|---|---|---|
| Standard | 5.80 | 5.99 | 6.24 | 6.43 | 6.68 | 6.87 | 7.12 |
| Camarilla | 6.36 | 6.40 | 6.44 | 6.48 | 6.52 | 6.56 | 6.60 |
| Woodie | 5.82 | 6.01 | 6.26 | 6.45 | 6.70 | 6.89 | 7.14 |
| Fibonacci | 5.99 | 6.16 | 6.27 | 6.43 | 6.60 | 6.71 | 6.87 |
| Pivot points | S3 | S2 | S1 | PP | R1 | R2 | R3 |
|---|---|---|---|---|---|---|---|
| Standard | 5.50 | 5.69 | 6.06 | 6.25 | 6.62 | 6.81 | 7.18 |
| Camarilla | 6.27 | 6.32 | 6.37 | 6.42 | 6.47 | 6.52 | 6.57 |
| Woodie | 5.58 | 5.74 | 6.14 | 6.30 | 6.70 | 6.86 | 7.26 |
| Fibonacci | 5.69 | 5.91 | 6.04 | 6.25 | 6.47 | 6.60 | 6.81 |
Numerical data
The following are the details of the technical indicators and moving averages that were collected to generate this technical analysis:
| RSI (14): | 51.34 | |
| MACD (12,26,9): | 0.0100 | |
| Directional Movement: | -3.78 | |
| AROON (14): | -35.71 | |
| DEMA (21): | 6.55 | |
| Parabolic SAR (0,02-0,02-0,2): | 6.53 | |
| Elder Ray (13): | -0 | |
| Super Trend (3,10): | 6.63 | |
| Zig ZAG (10): | 6.54 | |
| VORTEX (21): | 0.8700 | |
| Stochastique (14,3,5): | 29.96 | |
| TEMA (21): | 6.54 | |
| Williams %R (14): | -55.56 | |
| Chande Momentum Oscillator (20): | -0.01 | |
| Repulse (5,40,3): | -0.1600 | |
| ROCnROLL: | -1 | |
| TRIX (15,9): | 0.0300 | |
| Courbe Coppock: | 0.95 |
| MA7: | 6.52 | |
| MA20: | 6.29 | |
| MA50: | 6.28 | |
| MA100: | 6.41 | |
| MAexp7: | 6.54 | |
| MAexp20: | 6.54 | |
| MAexp50: | 6.49 | |
| MAexp100: | 6.39 | |
| Price / MA7: | +0.15% | |
| Price / MA20: | +3.82% | |
| Price / MA50: | +3.98% | |
| Price / MA100: | +1.87% | |
| Price / MAexp7: | -0.15% | |
| Price / MAexp20: | -0.15% | |
| Price / MAexp50: | +0.62% | |
| Price / MAexp100: | +2.19% |
News
The latest news and videos published on BONDUELLE at the time of the analysis were as follows:
- BONDUELLE - Monthly statement of the number of shares and voting rights
- BONDUELLE - Monthly statement of the number of shares and voting rights
- BONDUELLE - Monthly statement of the number of shares and voting rights
- Bonduelle - Quarter 1 FY 24-25 Sales: Stability of sales and groth in branded products over Quarter 1. Sales and current operatin income annual targets confirmed
- Bonduelle - Statement of availability of 2023-2024 Universal Registration Document
About author
Online


Add a comment
Comments
0 comments on the analysis BONDUELLE - 1H