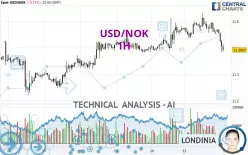
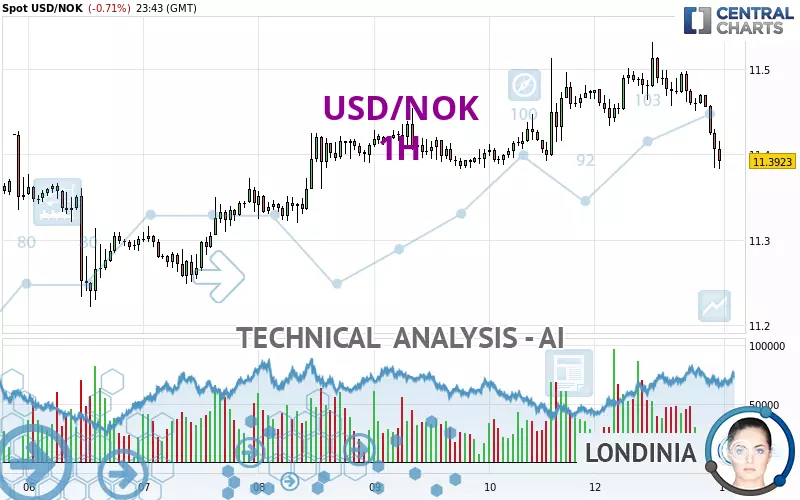
USD/NOK - 1H - Technical analysis published on 01/13/2025 (GMT)
- 136
- 0
Click here for a new analysis!
- Timeframe : 1H
- - Analysis generated on
- Status : LEVEL MAINTAINED
Summary of the analysis

Additional analysis
Quotes
The USD/NOK rating is 11.3923 NOK. On the day, this instrument lost -0.71% with the lowest point at 11.3829 NOK and the highest point at 11.5315 NOK. The deviation from the price is +0.08% for the low point and -1.21% for the high point.The Central Gaps scanner detects a bearish opening. A small advantage for sellers in the very short term.
Bearish opening
Type : Bearish
Timeframe : Openning
A study of price movements over other periods shows the following variations:
New HIGH record (1 year)
Type : Bullish
Timeframe : Weekly
New HIGH record (1st january)
Type : Bullish
Timeframe : Weekly
New HIGH record (1 month)
Type : Bullish
Timeframe : Weekly
Technical
Technical analysis of USD/NOK in 1H shows an overall slightly bearish trend. 53.57% of the signals given by moving averages are bearish. The overall trend could accelerate as a result of the strong bearish signals from short-term moving averages. The Central Indicators scanner detects a bearish signal on moving averages that could impact this trend:
Bearish trend reversal : adaptative moving average 100
Type : Bearish
Timeframe : 1 hour
An assessment of technical indicators does not currently provide any relevant information to suggest whether the signal given by the technical indicators is more bullish or bearish.
But beware of excesses. The Central Indicators scanner currently detects this:
CCI indicator is oversold : under -100
Type : Neutral
Timeframe : 1 hour
Previous candle closed under Bollinger bands
Type : Neutral
Timeframe : 1 hour
Williams %R indicator is oversold : under -80
Type : Neutral
Timeframe : 1 hour
Pivot points : price is under support 1
Type : Neutral
Timeframe : 1 hour
Price is back under the pivot point
Type : Bearish
Timeframe : Weekly
Central Patterns, the scanner specializing in chart patterns, did not identify any signals.
No result was found by the Central Candlesticks scanner on Japanese candlesticks.
| S3 | S2 | S1 | Price | R1 | R2 | |
|---|---|---|---|---|---|---|
| ProTrendLines | 11.2169 | 11.3326 | 11.3837 | 11.3923 | 11.4389 | 11.5129 |
| Change (%) | -1.54% | -0.52% | -0.08% | - | +0.41% | +1.06% |
| Change | -0.1754 | -0.0597 | -0.0086 | - | +0.0466 | +0.1206 |
| Level | Major | Minor | Intermediate | - | Intermediate | Intermediate |
Pivot points can also be used to set your price objectives. Here is the price situation in relation to pivot points:
| Pivot points | S3 | S2 | S1 | PP | R1 | R2 | R3 |
|---|---|---|---|---|---|---|---|
| Standard | 11.2772 | 11.3321 | 11.4031 | 11.4580 | 11.5290 | 11.5839 | 11.6549 |
| Camarilla | 11.4395 | 11.4510 | 11.4626 | 11.4741 | 11.4856 | 11.4972 | 11.5087 |
| Woodie | 11.2853 | 11.3361 | 11.4112 | 11.4620 | 11.5371 | 11.5879 | 11.6630 |
| Fibonacci | 11.3321 | 11.3802 | 11.4099 | 11.4580 | 11.5061 | 11.5358 | 11.5839 |
| Pivot points | S3 | S2 | S1 | PP | R1 | R2 | R3 |
|---|---|---|---|---|---|---|---|
| Standard | 11.0005 | 11.1108 | 11.2924 | 11.4027 | 11.5843 | 11.6946 | 11.8762 |
| Camarilla | 11.3938 | 11.4206 | 11.4473 | 11.4741 | 11.5009 | 11.5276 | 11.5544 |
| Woodie | 11.0363 | 11.1286 | 11.3282 | 11.4205 | 11.6201 | 11.7124 | 11.9120 |
| Fibonacci | 11.1108 | 11.2223 | 11.2912 | 11.4027 | 11.5142 | 11.5831 | 11.6946 |
| Pivot points | S3 | S2 | S1 | PP | R1 | R2 | R3 |
|---|---|---|---|---|---|---|---|
| Standard | 10.6358 | 10.8224 | 11.1039 | 11.2905 | 11.5720 | 11.7586 | 12.0401 |
| Camarilla | 11.2568 | 11.2997 | 11.3426 | 11.3855 | 11.4284 | 11.4713 | 11.5142 |
| Woodie | 10.6834 | 10.8461 | 11.1515 | 11.3142 | 11.6196 | 11.7823 | 12.0877 |
| Fibonacci | 10.8224 | 11.0012 | 11.1117 | 11.2905 | 11.4693 | 11.5798 | 11.7586 |
Numerical data
The following is the status of technical indicators and moving averages registered at the time this technical analysis was created:
| RSI (14): | 33.94 | |
| MACD (12,26,9): | -0.0086 | |
| Directional Movement: | -16.6876 | |
| AROON (14): | -92.8571 | |
| DEMA (21): | 11.4489 | |
| Parabolic SAR (0,02-0,02-0,2): | 11.5044 | |
| Elder Ray (13): | -0.0430 | |
| Super Trend (3,10): | 11.4805 | |
| Zig ZAG (10): | 11.3960 | |
| VORTEX (21): | 0.8981 | |
| Stochastique (14,3,5): | 9.76 | |
| TEMA (21): | 11.4293 | |
| Williams %R (14): | -89.17 | |
| Chande Momentum Oscillator (20): | -0.0938 | |
| Repulse (5,40,3): | -0.4687 | |
| ROCnROLL: | 2 | |
| TRIX (15,9): | 0.0028 | |
| Courbe Coppock: | 0.89 |
| MA7: | 11.3836 | |
| MA20: | 11.3444 | |
| MA50: | 11.1780 | |
| MA100: | 10.9410 | |
| MAexp7: | 11.4303 | |
| MAexp20: | 11.4554 | |
| MAexp50: | 11.4480 | |
| MAexp100: | 11.4234 | |
| Price / MA7: | +0.08% | |
| Price / MA20: | +0.42% | |
| Price / MA50: | +1.92% | |
| Price / MA100: | +4.12% | |
| Price / MAexp7: | -0.33% | |
| Price / MAexp20: | -0.55% | |
| Price / MAexp50: | -0.48% | |
| Price / MAexp100: | -0.27% |
News
The last news published on USD/NOK at the time of the generation of this analysis was as follows:
-
 USD/NOK Forecast November 5, 2024
-
USD/NOK Forecast October 29, 2024
-
USD/NOK Forecast September 26, 2024
-
USD/NOK Forecast September 11, 2024
-
USD/NOK Forecast August 30, 2024
About author

Online


Add a comment
Comments
0 comments on the analysis USD/NOK - 1H