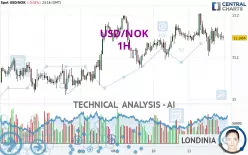
USD/NOK - 1H - Technical analysis published on 12/11/2024 (GMT)
- 144
- 0
Click here for a new analysis!
- Timeframe : 1H
- - Analysis generated on
- Status : INVALID

Summary of the analysis

Additional analysis
Quotes
The USD/NOK price is 11.1462 NOK. The price registered a decrease of -0.01% on the session and was traded between 11.1017 NOK and 11.2044 NOK over the period. The price is currently at +0.40% from its lowest and -0.52% from its highest.The Central Gaps scanner detects a bearish opening marking the presence of sellers ahead of buyers at the opening but not sufficiently marked to allow the price to register a quotation gap.
Bearish opening
Type : Bearish
Timeframe : Openning
So that you have an overall view of the price change, here is a table showing the variations over several periods:
New HIGH record (1 year)
Type : Bullish
Timeframe : Weekly
New HIGH record (1st january)
Type : Bullish
Timeframe : Weekly
New HIGH record (1 month)
Type : Bullish
Timeframe : Weekly
Technical
Technical analysis of this 1H chart of USD/NOK indicates that the overall trend is bullish. The signals given by moving averages are 75.00% bullish. This bullish trend could slow down given the neutral signals currently being given by short-term moving averages. The Central Indicators scanner does not detect any result on moving averages that would impact this trend.
An assessment of technical indicators does not currently provide any relevant information on the direction of future price movements.
Central Indicators, the detector scanner for these technical indicators recently detected a signal:
Williams %R indicator is back over -50
Type : Bullish
Timeframe : 1 hour
Central Patterns, the market scanner focusing on chart patterns, resistances and supports found this result:
Near support of channel
Type : Bullish
Timeframe : 1 hour
Central Candlesticks, the scanner specialised in Japanese candlesticks, detects this inversion signal that could impact the current short-term trend:
Doji
Type : Neutral
Timeframe : 1 hour
| S3 | S2 | S1 | Price | R1 | R2 | R3 | |
|---|---|---|---|---|---|---|---|
| ProTrendLines | 11.0930 | 11.1175 | 11.1329 | 11.1462 | 11.1587 | 11.1782 | 11.1984 |
| Change (%) | -0.48% | -0.26% | -0.12% | - | +0.11% | +0.29% | +0.47% |
| Change | -0.0532 | -0.0287 | -0.0133 | - | +0.0125 | +0.0320 | +0.0522 |
| Level | Intermediate | Intermediate | Minor | - | Intermediate | Minor | Intermediate |
To determine price objectives, it is also possible to use the pivot points. Here is the price position in relation to pivot points:
| Pivot points | S3 | S2 | S1 | PP | R1 | R2 | R3 |
|---|---|---|---|---|---|---|---|
| Standard | 11.0156 | 11.0543 | 11.1008 | 11.1395 | 11.1860 | 11.2247 | 11.2712 |
| Camarilla | 11.1239 | 11.1317 | 11.1395 | 11.1473 | 11.1551 | 11.1629 | 11.1707 |
| Woodie | 11.0195 | 11.0563 | 11.1047 | 11.1415 | 11.1899 | 11.2267 | 11.2751 |
| Fibonacci | 11.0543 | 11.0869 | 11.1070 | 11.1395 | 11.1721 | 11.1922 | 11.2247 |
| Pivot points | S3 | S2 | S1 | PP | R1 | R2 | R3 |
|---|---|---|---|---|---|---|---|
| Standard | 10.8747 | 10.9418 | 11.0486 | 11.1157 | 11.2225 | 11.2896 | 11.3964 |
| Camarilla | 11.1076 | 11.1235 | 11.1395 | 11.1554 | 11.1713 | 11.1873 | 11.2032 |
| Woodie | 10.8946 | 10.9517 | 11.0685 | 11.1256 | 11.2424 | 11.2995 | 11.4163 |
| Fibonacci | 10.9418 | 11.0082 | 11.0493 | 11.1157 | 11.1821 | 11.2232 | 11.2896 |
| Pivot points | S3 | S2 | S1 | PP | R1 | R2 | R3 |
|---|---|---|---|---|---|---|---|
| Standard | 10.4662 | 10.6426 | 10.8484 | 11.0248 | 11.2306 | 11.4070 | 11.6128 |
| Camarilla | 10.9492 | 10.9842 | 11.0193 | 11.0543 | 11.0893 | 11.1244 | 11.1594 |
| Woodie | 10.4810 | 10.6500 | 10.8632 | 11.0322 | 11.2454 | 11.4144 | 11.6276 |
| Fibonacci | 10.6426 | 10.7886 | 10.8788 | 11.0248 | 11.1708 | 11.2610 | 11.4070 |
Numerical data
The following are the details of the technical indicators and moving averages that were collected to generate this technical analysis:
| RSI (14): | 49.86 | |
| MACD (12,26,9): | 0.0011 | |
| Directional Movement: | -0.2909 | |
| AROON (14): | -35.7143 | |
| DEMA (21): | 11.1537 | |
| Parabolic SAR (0,02-0,02-0,2): | 11.1719 | |
| Elder Ray (13): | -0.0010 | |
| Super Trend (3,10): | 11.1978 | |
| Zig ZAG (10): | 11.1473 | |
| VORTEX (21): | 0.9981 | |
| Stochastique (14,3,5): | 48.63 | |
| TEMA (21): | 11.1505 | |
| Williams %R (14): | -45.54 | |
| Chande Momentum Oscillator (20): | -0.0156 | |
| Repulse (5,40,3): | -0.0226 | |
| ROCnROLL: | -1 | |
| TRIX (15,9): | 0.0027 | |
| Courbe Coppock: | 0.22 |
| MA7: | 11.1043 | |
| MA20: | 11.0837 | |
| MA50: | 10.9750 | |
| MA100: | 10.8309 | |
| MAexp7: | 11.1512 | |
| MAexp20: | 11.1517 | |
| MAexp50: | 11.1446 | |
| MAexp100: | 11.1287 | |
| Price / MA7: | +0.38% | |
| Price / MA20: | +0.56% | |
| Price / MA50: | +1.56% | |
| Price / MA100: | +2.91% | |
| Price / MAexp7: | -0.04% | |
| Price / MAexp20: | -0.05% | |
| Price / MAexp50: | +0.01% | |
| Price / MAexp100: | +0.16% |
News
The last news published on USD/NOK at the time of the generation of this analysis was as follows:
-
 USD/NOK Forecast November 5, 2024
-
USD/NOK Forecast October 29, 2024
-
USD/NOK Forecast September 26, 2024
-
USD/NOK Forecast September 11, 2024
-
USD/NOK Forecast August 30, 2024
About author
Online


Add a comment
Comments
0 comments on the analysis USD/NOK - 1H