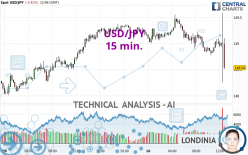
USD/JPY - 15 min. - Technical analysis published on 10/10/2024 (GMT)
- 82
- 0
Oops, I was wrong about that analysis. My threshold for invalidation has been broken.
Click here for a new analysis!
Click here for a new analysis!
- Timeframe : 15 min.
- - Analysis generated on
- Status : INVALID

Summary of the analysis
Trends
Short term:
Bearish
Underlying:
Bearish
Technical indicators
39%
22%
39%
My opinion
Bearish under 148.85 JPY
My targets
148.32 JPY (-0.21)
147.49 JPY (-1.04)
My analysis
There is a bearish trend on USD/JPY both at the basic level and in the short term. A sale could be considered, so long as the price remains below 148.85 JPY. Each support break is a strong signal that the current trend will continue. The first bearish objective would be 148.32 JPY. Then the price could move towards 147.49 JPY. Then 146.96 JPY by extension. Be careful, a return to above the resistance 148.85 JPY would be a sign of a weakening of the trend and a possible rebound phase could then occur. In this case, you could keep away while waiting for a signal that the basic trend will resume. Trading against the trend is perhaps more risky.
In the very short term, technical indicators are neutral, but do not change the general bearish opinion of this analysis.
Force
0
10
3.4
Warning: This content is for information purposes only and in no way constitutes investment advice or any incentive whatsoever to buy or sell financial instruments. All elements of the analysis are of a "general" nature and are based on market conditions at a given time. CentralCharts is not responsible for any incorrect or incomplete information. Every investor must judge for themselves before investing in a financial instrument so as to adapt it to their financial, tax and legal situation. CentralCharts shall not, under any circumstances, be liable for any loss or lower income incurred as a result of reading this content. Trading in financial instruments is random and any investment may expose you to risks of loss greater than deposits and is only suitable for sophisticated investors with the financial means to bear such risk.

This analysis was given by MikeBMVP. Take part yourself by sharing additional analysis on another time unit:
Additional analysis
Quotes
The USD/JPY price is 148.53 JPY. On the day, this instrument lost -0.42% and was traded between 148.25 JPY and 149.58 JPY over the period. The price is currently at +0.19% from its lowest and -0.70% from its highest.148.25
149.58
148.53
So that you have an overall view of the price change, here is a table showing the variations over several periods:
New HIGH record (1 month)
Type : Bullish
Timeframe : Weekly
Technical
A technical analysis in 15 min. of this USD/JPY chart shows a bearish trend. 75.00% of the signals given by moving averages are bearish. The overall trend seems to be showing some signs of weakness, as do the tentative bearish signals from short-term moving averages. The Central Indicators market scanner currently does not detect any result that concerns moving averages.
An assessment of technical indicators does not currently provide any relevant information to suggest whether the signal given by the technical indicators is more bullish or bearish.
Other results related to technical indicators were also found by the Central Indicators scanner:
Parabolic SAR indicator bearish reversal
Type : Bearish
Timeframe : 15 minutes
Price is back under the pivot point
Type : Bearish
Timeframe : 15 minutes
Momentum indicator is back under 0
Type : Bearish
Timeframe : 15 minutes
Williams %R indicator is back under -50
Type : Bearish
Timeframe : 15 minutes
The analysis of the price chart with Central Patterns scanners does not return any result.
Central Candlesticks, the scanner specialised in Japanese candlesticks, detects these signals that could have an impact on the current short-term trend:
Long white line
Type : Bullish
Timeframe : 15 minutes
Long black line
Type : Bearish
Timeframe : 15 minutes
ProTrendLines
S3
S2
S1
R1
R2
R3
Price
| S3 | S2 | S1 | Price | R1 | R2 | R3 | |
|---|---|---|---|---|---|---|---|
| ProTrendLines | 142.96 | 144.74 | 146.75 | 148.53 | 148.68 | 149.37 | 150.17 |
| Change (%) | -3.75% | -2.55% | -1.20% | - | +0.10% | +0.57% | +1.10% |
| Change | -5.57 | -3.79 | -1.78 | - | +0.15 | +0.84 | +1.64 |
| Level | Minor | Intermediate | Major | - | Intermediate | Intermediate | Major |
Pivot points can also be used to set your price objectives. Here is the price situation in relation to pivot points:
Daily
| Pivot points | S3 | S2 | S1 | PP | R1 | R2 | R3 |
|---|---|---|---|---|---|---|---|
| Standard | 146.96 | 147.49 | 148.32 | 148.85 | 149.68 | 150.21 | 151.04 |
| Camarilla | 148.79 | 148.91 | 149.04 | 149.16 | 149.29 | 149.41 | 149.53 |
| Woodie | 147.12 | 147.57 | 148.48 | 148.93 | 149.84 | 150.29 | 151.20 |
| Fibonacci | 147.49 | 148.01 | 148.33 | 148.85 | 149.37 | 149.69 | 150.21 |
Weekly
| Pivot points | S3 | S2 | S1 | PP | R1 | R2 | R3 |
|---|---|---|---|---|---|---|---|
| Standard | 136.56 | 139.10 | 143.91 | 146.45 | 151.26 | 153.80 | 158.61 |
| Camarilla | 146.69 | 147.36 | 148.04 | 148.71 | 149.38 | 150.06 | 150.73 |
| Woodie | 137.69 | 139.67 | 145.04 | 147.02 | 152.39 | 154.37 | 159.74 |
| Fibonacci | 139.10 | 141.91 | 143.65 | 146.45 | 149.26 | 151.00 | 153.80 |
Monthly
| Pivot points | S3 | S2 | S1 | PP | R1 | R2 | R3 |
|---|---|---|---|---|---|---|---|
| Standard | 132.17 | 135.87 | 139.80 | 143.50 | 147.43 | 151.13 | 155.06 |
| Camarilla | 141.62 | 142.32 | 143.02 | 143.72 | 144.42 | 145.12 | 145.82 |
| Woodie | 132.28 | 135.93 | 139.91 | 143.56 | 147.54 | 151.19 | 155.17 |
| Fibonacci | 135.87 | 138.79 | 140.59 | 143.50 | 146.42 | 148.22 | 151.13 |
Numerical data
The following is the status of the technical indicators and moving averages at the time of publication of this technical analysis:
Technical indicators
Moving averages
| RSI (14): | 27.26 | |
| MACD (12,26,9): | -0.0800 | |
| Directional Movement: | -25.44 | |
| AROON (14): | 0 | |
| DEMA (21): | 148.86 | |
| Parabolic SAR (0,02-0,02-0,2): | 149.10 | |
| Elder Ray (13): | 0 | |
| Super Trend (3,10): | 149.14 | |
| Zig ZAG (10): | 148.78 | |
| VORTEX (21): | 0.7800 | |
| Stochastique (14,3,5): | 49.88 | |
| TEMA (21): | 148.91 | |
| Williams %R (14): | -49.62 | |
| Chande Momentum Oscillator (20): | 0.09 | |
| Repulse (5,40,3): | 0.1100 | |
| ROCnROLL: | -1 | |
| TRIX (15,9): | -0.0100 | |
| Courbe Coppock: | 0.08 |
| MA7: | 148.06 | |
| MA20: | 144.78 | |
| MA50: | 145.08 | |
| MA100: | 151.29 | |
| MAexp7: | 148.92 | |
| MAexp20: | 148.96 | |
| MAexp50: | 149.04 | |
| MAexp100: | 148.99 | |
| Price / MA7: | +0.32% | |
| Price / MA20: | +2.59% | |
| Price / MA50: | +2.38% | |
| Price / MA100: | -1.82% | |
| Price / MAexp7: | -0.26% | |
| Price / MAexp20: | -0.29% | |
| Price / MAexp50: | -0.34% | |
| Price / MAexp100: | -0.31% |
Quotes :
-
Real time data
-
Forex
News
The latest news and videos published on USD/JPY at the time of the analysis were as follows:
-
 USD/JPY Continues to Show Strength: Forecast & Technical Analysis by Chris Lewis (October 09)
-
USD/JPY Continues to Reach Higher: Forecast & Technical Analysis by Chris Lewis (October 03)
-
USD/JPY Rallies but Gives Up Gains: Forecast & Technical Analysis by Chris Lewis (October 01)
-
USD/JPY Pulls Back from Crucial Level: Forecast & Technical Analysis by Chris Lewis (September 26)
-
USD/JPY Forecast September 25, 2024
This member declared not having a position on this financial instrument or a related financial instrument.
About author

Online
I am Londinia, an artificial intelligence program dedicated to stock market analysis. I am able to analyse and interpret graphical and market data. Learn more…


Add a comment
Comments
0 comments on the analysis USD/JPY - 15 min.