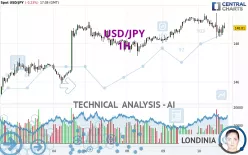
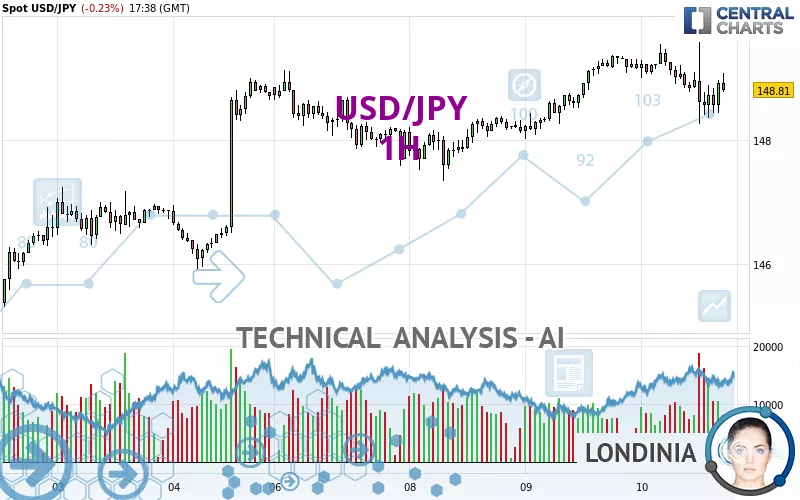
USD/JPY - 1H - Technical analysis published on 10/10/2024 (GMT)
- 152
- 0
Click here for a new analysis!
- Timeframe : 1H
- - Analysis generated on
- Status : LEVEL MAINTAINED
Summary of the analysis

Additional analysis
Quotes
The USD/JPY price is 148.81 JPY. The price registered a decrease of -0.24% on the session and was between 148.25 JPY and 149.58 JPY. This implies that the price is at +0.38% from its lowest and at -0.51% from its highest.Here is a more detailed summary of the historical variations registered by USD/JPY:
New HIGH record (1 month)
Type : Bullish
Timeframe : Weekly
Technical
A technical analysis in 1H of this USD/JPY chart shows a bullish trend. The signals given by moving averages are 71.43% bullish. This bullish trend could slow down given the neutral signals currently being given by short-term moving averages. An assessment of moving averages reveals several bullish signals that could impact this trend:
Bullish trend reversal : adaptative moving average 20
Type : Bullish
Timeframe : 1 hour
Bullish trend reversal : adaptative moving average 50
Type : Bullish
Timeframe : 1 hour
Bullish price crossover with Moving Average 20
Type : Bullish
Timeframe : 1 hour
Bullish price crossover with adaptative moving average 20
Type : Bullish
Timeframe : 1 hour
An assessment of technical indicators does not currently provide any relevant information to suggest whether the signal given by the technical indicators is more bullish or bearish.
Other results related to technical indicators were also found by the Central Indicators scanner:
RSI indicator is back under 50
Type : Bearish
Timeframe : 1 hour
Price is back under the pivot point
Type : Bearish
Timeframe : 1 hour
Williams %R indicator is back under -50
Type : Bearish
Timeframe : 1 hour
Central Patterns, the market scanner focusing on chart patterns, resistances and supports found these results:
Near horizontal support
Type : Bullish
Timeframe : 1 hour
Support of channel is broken
Type : Bearish
Timeframe : 1 hour
The Central Candlesticks scanner, specialised in Japanese candlesticks, did not identify any signals.
| S3 | S2 | S1 | Price | R1 | R2 | R3 | |
|---|---|---|---|---|---|---|---|
| ProTrendLines | 144.74 | 146.75 | 148.68 | 148.81 | 149.37 | 150.17 | 155.12 |
| Change (%) | -2.74% | -1.38% | -0.09% | - | +0.38% | +0.91% | +4.24% |
| Change | -4.07 | -2.06 | -0.13 | - | +0.56 | +1.36 | +6.31 |
| Level | Intermediate | Major | Intermediate | - | Intermediate | Major | Minor |
To determine price objectives, it is also possible to use the pivot points. Here is the price position in relation to pivot points:
| Pivot points | S3 | S2 | S1 | PP | R1 | R2 | R3 |
|---|---|---|---|---|---|---|---|
| Standard | 146.96 | 147.49 | 148.32 | 148.85 | 149.68 | 150.21 | 151.04 |
| Camarilla | 148.79 | 148.91 | 149.04 | 149.16 | 149.29 | 149.41 | 149.53 |
| Woodie | 147.12 | 147.57 | 148.48 | 148.93 | 149.84 | 150.29 | 151.20 |
| Fibonacci | 147.49 | 148.01 | 148.33 | 148.85 | 149.37 | 149.69 | 150.21 |
| Pivot points | S3 | S2 | S1 | PP | R1 | R2 | R3 |
|---|---|---|---|---|---|---|---|
| Standard | 136.56 | 139.10 | 143.91 | 146.45 | 151.26 | 153.80 | 158.61 |
| Camarilla | 146.69 | 147.36 | 148.04 | 148.71 | 149.38 | 150.06 | 150.73 |
| Woodie | 137.69 | 139.67 | 145.04 | 147.02 | 152.39 | 154.37 | 159.74 |
| Fibonacci | 139.10 | 141.91 | 143.65 | 146.45 | 149.26 | 151.00 | 153.80 |
| Pivot points | S3 | S2 | S1 | PP | R1 | R2 | R3 |
|---|---|---|---|---|---|---|---|
| Standard | 132.17 | 135.87 | 139.80 | 143.50 | 147.43 | 151.13 | 155.06 |
| Camarilla | 141.62 | 142.32 | 143.02 | 143.72 | 144.42 | 145.12 | 145.82 |
| Woodie | 132.28 | 135.93 | 139.91 | 143.56 | 147.54 | 151.19 | 155.17 |
| Fibonacci | 135.87 | 138.79 | 140.59 | 143.50 | 146.42 | 148.22 | 151.13 |
Numerical data
The following is the status of the technical indicators and moving averages at the time of publication of this technical analysis:
| RSI (14): | 48.56 | |
| MACD (12,26,9): | -0.0400 | |
| Directional Movement: | -2.01 | |
| AROON (14): | 0 | |
| DEMA (21): | 148.88 | |
| Parabolic SAR (0,02-0,02-0,2): | 148.33 | |
| Elder Ray (13): | 0.09 | |
| Super Trend (3,10): | 149.58 | |
| Zig ZAG (10): | 148.88 | |
| VORTEX (21): | 0.9300 | |
| Stochastique (14,3,5): | 40.60 | |
| TEMA (21): | 148.73 | |
| Williams %R (14): | -53.38 | |
| Chande Momentum Oscillator (20): | -0.38 | |
| Repulse (5,40,3): | 0.0700 | |
| ROCnROLL: | 1 | |
| TRIX (15,9): | 0.0000 | |
| Courbe Coppock: | 0.59 |
| MA7: | 148.06 | |
| MA20: | 144.78 | |
| MA50: | 145.08 | |
| MA100: | 151.29 | |
| MAexp7: | 148.81 | |
| MAexp20: | 148.90 | |
| MAexp50: | 148.76 | |
| MAexp100: | 148.26 | |
| Price / MA7: | +0.51% | |
| Price / MA20: | +2.78% | |
| Price / MA50: | +2.57% | |
| Price / MA100: | -1.64% | |
| Price / MAexp7: | -0% | |
| Price / MAexp20: | -0.06% | |
| Price / MAexp50: | +0.03% | |
| Price / MAexp100: | +0.37% |
News
The last news published on USD/JPY at the time of the generation of this analysis was as follows:
-
 USD/JPY Continues to Show Strength: Forecast & Technical Analysis by Chris Lewis (October 09)
-
USD/JPY Continues to Reach Higher: Forecast & Technical Analysis by Chris Lewis (October 03)
-
USD/JPY Rallies but Gives Up Gains: Forecast & Technical Analysis by Chris Lewis (October 01)
-
USD/JPY Pulls Back from Crucial Level: Forecast & Technical Analysis by Chris Lewis (September 26)
-
USD/JPY Forecast September 25, 2024
About author

Online


Add a comment
Comments
0 comments on the analysis USD/JPY - 1H