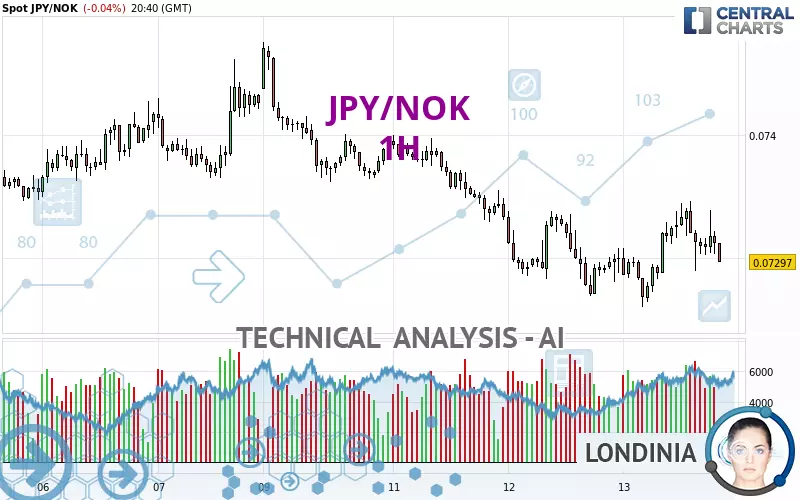
JPY/NOK - 1H - Technical analysis published on 02/13/2025 (GMT)
- 91
- 0
Click here for a new analysis!
- Timeframe : 1H
- - Analysis generated on
- Status : INVALID
Summary of the analysis

Additional analysis
Quotes
The JPY/NOK price is 0.07297 NOK. The price is lower by -0.04% since the last closing and was between 0.07260 NOK and 0.07346 NOK. This implies that the price is at +0.51% from its lowest and at -0.67% from its highest.Here is a more detailed summary of the historical variations registered by JPY/NOK:
Near a new HIGH record (1st january)
Type : Bullish
Timeframe : Weekly
Near a new HIGH record (1 month)
Type : Bullish
Timeframe : Weekly
Technical
Technical analysis of this 1H chart of JPY/NOK indicates that the overall trend is strongly bearish. 85.71% of the signals given by moving averages are bearish. The slightly bearish signals from short-term moving averages show that the overall trend is slowing down. The Central Indicators market scanner is currently detecting several bearish signals that could impact this trend:
Bearish price crossover with Moving Average 20
Type : Bearish
Timeframe : 1 hour
Bearish price crossover with Moving Average 50
Type : Bearish
Timeframe : 1 hour
Bearish price crossover with adaptative moving average 20
Type : Bearish
Timeframe : 1 hour
Bearish price crossover with adaptative moving average 50
Type : Bearish
Timeframe : 1 hour
In fact, of the 18 technical indicators analysed by Central Analyzer, 4 are bullish, 8 are neutral and 6 are bearish. Central Indicators, the detector scanner for these technical indicators has recently detected several signals:
Pivot points : price is under support 1
Type : Neutral
Timeframe : Weekly
Price is back under the pivot point
Type : Bearish
Timeframe : 1 hour
An analysis of the price chart with the Central Patterns scanner (detector of chart patterns and resistances and supports) shows a result that can have an impact on the price change:
Resistance of channel is broken
Type : Bullish
Timeframe : 1 hour
The Central Candlesticks scanner which studies Japanese candlesticks did not detect anything.
| S3 | S2 | S1 | Price | R1 | R2 | R3 | |
|---|---|---|---|---|---|---|---|
| ProTrendLines | 0.06830 | 0.07089 | 0.07271 | 0.07297 | 0.07364 | 0.07400 | 0.07435 |
| Change (%) | -6.40% | -2.85% | -0.36% | - | +0.92% | +1.41% | +1.89% |
| Change | -0.00467 | -0.00208 | -0.00026 | - | +0.00067 | +0.00103 | +0.00138 |
| Level | Major | Major | Major | - | Major | Minor | Minor |
Attention could also be paid to pivot points to set price objectives:
| Pivot points | S3 | S2 | S1 | PP | R1 | R2 | R3 |
|---|---|---|---|---|---|---|---|
| Standard | 0.07198 | 0.07233 | 0.07267 | 0.07302 | 0.07336 | 0.07371 | 0.07405 |
| Camarilla | 0.07281 | 0.07287 | 0.07294 | 0.07300 | 0.07306 | 0.07313 | 0.07319 |
| Woodie | 0.07197 | 0.07233 | 0.07266 | 0.07302 | 0.07335 | 0.07371 | 0.07404 |
| Fibonacci | 0.07233 | 0.07260 | 0.07276 | 0.07302 | 0.07329 | 0.07345 | 0.07371 |
| Pivot points | S3 | S2 | S1 | PP | R1 | R2 | R3 |
|---|---|---|---|---|---|---|---|
| Standard | 0.07115 | 0.07191 | 0.07309 | 0.07385 | 0.07503 | 0.07579 | 0.07697 |
| Camarilla | 0.07373 | 0.07390 | 0.07408 | 0.07426 | 0.07444 | 0.07462 | 0.07479 |
| Woodie | 0.07135 | 0.07202 | 0.07329 | 0.07396 | 0.07523 | 0.07590 | 0.07717 |
| Fibonacci | 0.07191 | 0.07265 | 0.07311 | 0.07385 | 0.07459 | 0.07505 | 0.07579 |
| Pivot points | S3 | S2 | S1 | PP | R1 | R2 | R3 |
|---|---|---|---|---|---|---|---|
| Standard | 0.06937 | 0.07034 | 0.07168 | 0.07265 | 0.07399 | 0.07496 | 0.07630 |
| Camarilla | 0.07239 | 0.07260 | 0.07281 | 0.07302 | 0.07323 | 0.07344 | 0.07366 |
| Woodie | 0.06956 | 0.07043 | 0.07187 | 0.07274 | 0.07418 | 0.07505 | 0.07649 |
| Fibonacci | 0.07034 | 0.07122 | 0.07177 | 0.07265 | 0.07353 | 0.07408 | 0.07496 |
Numerical data
The following is the status of technical indicators and moving averages registered at the time this technical analysis was created:
| RSI (14): | 46.48 | |
| MACD (12,26,9): | 0.0000 | |
| Directional Movement: | 2.64978 | |
| AROON (14): | 57.14286 | |
| DEMA (21): | 0.07312 | |
| Parabolic SAR (0,02-0,02-0,2): | 0.07346 | |
| Elder Ray (13): | -0.00005 | |
| Super Trend (3,10): | 0.07280 | |
| Zig ZAG (10): | 0.07301 | |
| VORTEX (21): | 1.0289 | |
| Stochastique (14,3,5): | 49.49 | |
| TEMA (21): | 0.07318 | |
| Williams %R (14): | -73.02 | |
| Chande Momentum Oscillator (20): | -0.00019 | |
| Repulse (5,40,3): | -0.2329 | |
| ROCnROLL: | 2 | |
| TRIX (15,9): | 0.0048 | |
| Courbe Coppock: | 0.59 |
| MA7: | 0.07361 | |
| MA20: | 0.07305 | |
| MA50: | 0.07280 | |
| MA100: | 0.07255 | |
| MAexp7: | 0.07311 | |
| MAexp20: | 0.07310 | |
| MAexp50: | 0.07317 | |
| MAexp100: | 0.07333 | |
| Price / MA7: | -0.87% | |
| Price / MA20: | -0.11% | |
| Price / MA50: | +0.23% | |
| Price / MA100: | +0.58% | |
| Price / MAexp7: | -0.19% | |
| Price / MAexp20: | -0.18% | |
| Price / MAexp50: | -0.27% | |
| Price / MAexp100: | -0.49% |
About author
Online


Add a comment
Comments
0 comments on the analysis JPY/NOK - 1H