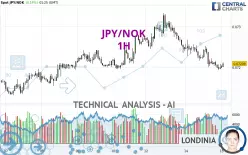
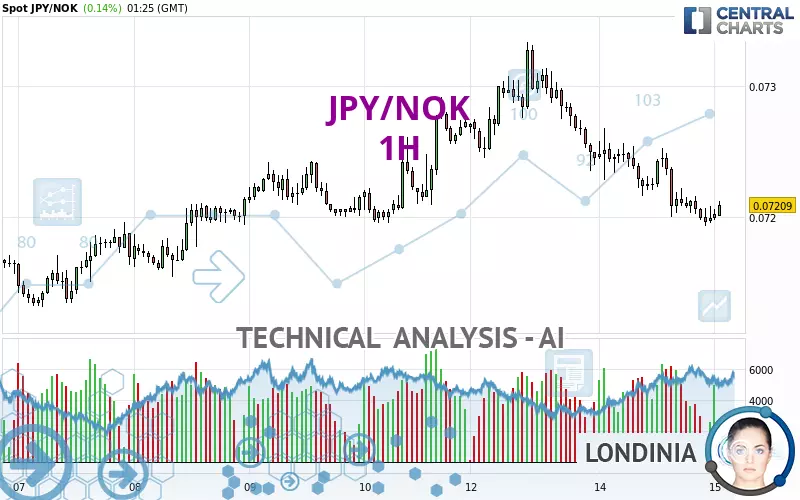
JPY/NOK - 1H - Technical analysis published on 01/15/2025 (GMT)
- 120
- 0
Click here for a new analysis!
- Timeframe : 1H
- - Analysis generated on
- Status : LEVEL MAINTAINED
Summary of the analysis

Additional analysis
Quotes
The JPY/NOK rating is 0.07209 NOK. The price registered an increase of +0.14% on the session and was between 0.07198 NOK and 0.07212 NOK. This implies that the price is at +0.15% from its lowest and at -0.04% from its highest.So that you have an overall view of the price change, here is a table showing the variations over several periods:
Near a new HIGH record (1st january)
Type : Bullish
Timeframe : Weekly
Near a new HIGH record (1 month)
Type : Bullish
Timeframe : Weekly
Technical
A technical analysis in 1H of this JPY/NOK chart shows a bearish trend. The signals given by moving averages are 75.00% bearish. This bearish trend is reinforced by the strong signals currently being given by short-term moving averages. The Central Indicators scanner detects a bullish signal on moving averages that could impact this trend:
Bullish trend reversal : Moving Average 100
Type : Bullish
Timeframe : 1 hour
In fact, Central Analyzer took into account 18 technical indicators and the result was as follows: 4 are bullish, 4 are neutral and 10 are bearish. Central Indicators, the detector scanner for these technical indicators has recently detected several signals:
MACD crosses UP its Moving Average
Type : Bullish
Timeframe : 1 hour
Price is back under the pivot point
Type : Bearish
Timeframe : Weekly
Central Patterns, the market scanner focusing on chart patterns, resistances and supports found this result:
Support of channel is broken
Type : Bearish
Timeframe : 1 hour
No result was found by the Central Candlesticks scanner on Japanese candlesticks.
| S3 | S2 | S1 | Price | R1 | R2 | R3 | |
|---|---|---|---|---|---|---|---|
| ProTrendLines | 0.07131 | 0.07154 | 0.07195 | 0.07209 | 0.07244 | 0.07271 | 0.07292 |
| Change (%) | -1.08% | -0.76% | -0.19% | - | +0.49% | +0.86% | +1.15% |
| Change | -0.00078 | -0.00055 | -0.00014 | - | +0.00035 | +0.00062 | +0.00083 |
| Level | Minor | Minor | Major | - | Intermediate | Major | Minor |
Attention could also be paid to pivot points to set price objectives:
| Pivot points | S3 | S2 | S1 | PP | R1 | R2 | R3 |
|---|---|---|---|---|---|---|---|
| Standard | 0.07097 | 0.07145 | 0.07172 | 0.07220 | 0.07247 | 0.07295 | 0.07322 |
| Camarilla | 0.07178 | 0.07185 | 0.07192 | 0.07199 | 0.07206 | 0.07213 | 0.07220 |
| Woodie | 0.07087 | 0.07140 | 0.07162 | 0.07215 | 0.07237 | 0.07290 | 0.07312 |
| Fibonacci | 0.07145 | 0.07174 | 0.07191 | 0.07220 | 0.07249 | 0.07266 | 0.07295 |
| Pivot points | S3 | S2 | S1 | PP | R1 | R2 | R3 |
|---|---|---|---|---|---|---|---|
| Standard | 0.07011 | 0.07071 | 0.07172 | 0.07232 | 0.07333 | 0.07393 | 0.07494 |
| Camarilla | 0.07229 | 0.07244 | 0.07258 | 0.07273 | 0.07288 | 0.07303 | 0.07317 |
| Woodie | 0.07032 | 0.07081 | 0.07193 | 0.07242 | 0.07354 | 0.07403 | 0.07515 |
| Fibonacci | 0.07071 | 0.07133 | 0.07171 | 0.07232 | 0.07294 | 0.07332 | 0.07393 |
| Pivot points | S3 | S2 | S1 | PP | R1 | R2 | R3 |
|---|---|---|---|---|---|---|---|
| Standard | 0.06824 | 0.07001 | 0.07119 | 0.07296 | 0.07414 | 0.07591 | 0.07709 |
| Camarilla | 0.07156 | 0.07183 | 0.07210 | 0.07237 | 0.07264 | 0.07291 | 0.07318 |
| Woodie | 0.06795 | 0.06986 | 0.07090 | 0.07281 | 0.07385 | 0.07576 | 0.07680 |
| Fibonacci | 0.07001 | 0.07114 | 0.07183 | 0.07296 | 0.07409 | 0.07478 | 0.07591 |
Numerical data
The following is the status of technical indicators and moving averages registered at the time this technical analysis was created:
| RSI (14): | 36.44 | |
| MACD (12,26,9): | -0.0001 | |
| Directional Movement: | -13.20550 | |
| AROON (14): | -64.28572 | |
| DEMA (21): | 0.07200 | |
| Parabolic SAR (0,02-0,02-0,2): | 0.07236 | |
| Elder Ray (13): | -0.00007 | |
| Super Trend (3,10): | 0.07244 | |
| Zig ZAG (10): | 0.07210 | |
| VORTEX (21): | 0.8680 | |
| Stochastique (14,3,5): | 18.33 | |
| TEMA (21): | 0.07195 | |
| Williams %R (14): | -68.33 | |
| Chande Momentum Oscillator (20): | -0.00034 | |
| Repulse (5,40,3): | 0.1041 | |
| ROCnROLL: | 2 | |
| TRIX (15,9): | -0.0291 | |
| Courbe Coppock: | 0.89 |
| MA7: | 0.07218 | |
| MA20: | 0.07231 | |
| MA50: | 0.07241 | |
| MA100: | 0.07276 | |
| MAexp7: | 0.07204 | |
| MAexp20: | 0.07218 | |
| MAexp50: | 0.07235 | |
| MAexp100: | 0.07235 | |
| Price / MA7: | -0.12% | |
| Price / MA20: | -0.30% | |
| Price / MA50: | -0.44% | |
| Price / MA100: | -0.92% | |
| Price / MAexp7: | +0.07% | |
| Price / MAexp20: | -0.12% | |
| Price / MAexp50: | -0.36% | |
| Price / MAexp100: | -0.36% |
About author
Online


Add a comment
Comments
0 comments on the analysis JPY/NOK - 1H