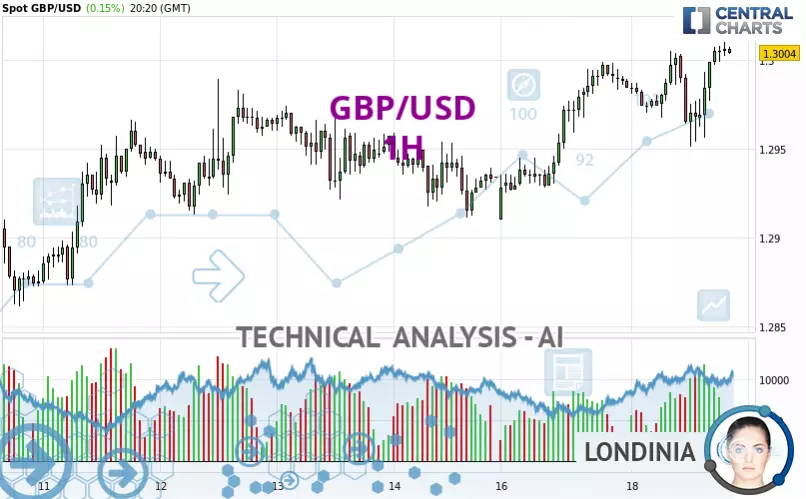
GBP/USD - 1H - Technical analysis published on 03/18/2025 (GMT)
- 134
- 0
Click here for a new analysis!
- Timeframe : 1H
- - Analysis generated on
- Status : INVALID

Summary of the analysis

Additional analysis
Quotes
GBP/USD rating 1.3004 USD. The price registered an increase of +0.15% on the session and was between 1.2951 USD and 1.3010 USD. This implies that the price is at +0.41% from its lowest and at -0.05% from its highest.Here is a more detailed summary of the historical variations registered by GBP/USD:
Near a new HIGH record (1 year)
Type : Bullish
Timeframe : Weekly
New HIGH record (1st january)
Type : Bullish
Timeframe : Weekly
New HIGH record (1 month)
Type : Bullish
Timeframe : Weekly
Technical
A technical analysis in 1H of this GBP/USD chart shows a strongly bullish trend. The signals given by the moving averages are 92.86% bullish. This strong bullish trend is confirmed by the strong signals currently being given by short-term moving averages. There is no crossing of moving average by the price or crossing of moving averages between themselves.
The probability of a further increase is high given the direction of the technical indicators.
Caution: the Central Indicators scanner currently detects an excess:
CCI indicator is overbought : over 100
Type : Neutral
Timeframe : 1 hour
RSI indicator: bearish divergence
Type : Bearish
Timeframe : 1 hour
Williams %R indicator is overbought : over -20
Type : Neutral
Timeframe : 1 hour
Pivot points : price is over resistance 1 (Daily)
Type : Neutral
Timeframe : Weekly
Pivot points : price is over resistance 1 (Weekly)
Type : Neutral
Timeframe : 1 hour
Pivot points : price is over resistance 1 (Monthly)
Type : Neutral
Timeframe : 1 hour
Central Patterns, the market scanner focusing on chart patterns, resistances and supports found this result:
Near resistance of channel
Type : Bearish
Timeframe : 1 hour
There is also a Japanese candlestick pattern detected by Central Candlesticks that could mark the end of the current short-term trend:
Doji
Type : Neutral
Timeframe : 1 hour
| S3 | S2 | S1 | Price | R1 | R2 | R3 | |
|---|---|---|---|---|---|---|---|
| ProTrendLines | 1.2946 | 1.2966 | 1.2999 | 1.3004 | 1.3128 | 1.3255 | 1.3423 |
| Change (%) | -0.45% | -0.29% | -0.04% | - | +0.95% | +1.93% | +3.22% |
| Change | -0.0058 | -0.0038 | -0.0005 | - | +0.0124 | +0.0251 | +0.0419 |
| Level | Major | Minor | Intermediate | - | Major | Minor | Major |
To determine price objectives, it is also possible to use the pivot points. Here is the price position in relation to pivot points:
| Pivot points | S3 | S2 | S1 | PP | R1 | R2 | R3 |
|---|---|---|---|---|---|---|---|
| Standard | 1.2841 | 1.2875 | 1.2930 | 1.2964 | 1.3019 | 1.3053 | 1.3108 |
| Camarilla | 1.2960 | 1.2968 | 1.2976 | 1.2984 | 1.2992 | 1.3000 | 1.3009 |
| Woodie | 1.2851 | 1.2880 | 1.2940 | 1.2969 | 1.3029 | 1.3058 | 1.3118 |
| Fibonacci | 1.2875 | 1.2909 | 1.2930 | 1.2964 | 1.2998 | 1.3019 | 1.3053 |
| Pivot points | S3 | S2 | S1 | PP | R1 | R2 | R3 |
|---|---|---|---|---|---|---|---|
| Standard | 1.2739 | 1.2800 | 1.2867 | 1.2928 | 1.2995 | 1.3056 | 1.3123 |
| Camarilla | 1.2899 | 1.2911 | 1.2922 | 1.2934 | 1.2946 | 1.2958 | 1.2969 |
| Woodie | 1.2742 | 1.2802 | 1.2870 | 1.2930 | 1.2998 | 1.3058 | 1.3126 |
| Fibonacci | 1.2800 | 1.2849 | 1.2879 | 1.2928 | 1.2977 | 1.3007 | 1.3056 |
| Pivot points | S3 | S2 | S1 | PP | R1 | R2 | R3 |
|---|---|---|---|---|---|---|---|
| Standard | 1.1845 | 1.2047 | 1.2312 | 1.2514 | 1.2779 | 1.2981 | 1.3246 |
| Camarilla | 1.2449 | 1.2491 | 1.2534 | 1.2577 | 1.2620 | 1.2663 | 1.2705 |
| Woodie | 1.1877 | 1.2063 | 1.2344 | 1.2530 | 1.2811 | 1.2997 | 1.3278 |
| Fibonacci | 1.2047 | 1.2225 | 1.2336 | 1.2514 | 1.2692 | 1.2803 | 1.2981 |
Numerical data
The following is the status of the technical indicators and moving averages at the time of publication of this technical analysis:
| RSI (14): | 63.12 | |
| MACD (12,26,9): | 0.0008 | |
| Directional Movement: | 7.4605 | |
| AROON (14): | 50.0000 | |
| DEMA (21): | 1.2998 | |
| Parabolic SAR (0,02-0,02-0,2): | 1.2962 | |
| Elder Ray (13): | 0.0013 | |
| Super Trend (3,10): | 1.2964 | |
| Zig ZAG (10): | 1.3006 | |
| VORTEX (21): | 1.0640 | |
| Stochastique (14,3,5): | 93.73 | |
| TEMA (21): | 1.3000 | |
| Williams %R (14): | -6.78 | |
| Chande Momentum Oscillator (20): | 0.0009 | |
| Repulse (5,40,3): | 0.0972 | |
| ROCnROLL: | 1 | |
| TRIX (15,9): | 0.0065 | |
| Courbe Coppock: | 0.21 |
| MA7: | 1.2952 | |
| MA20: | 1.2794 | |
| MA50: | 1.2554 | |
| MA100: | 1.2624 | |
| MAexp7: | 1.2998 | |
| MAexp20: | 1.2988 | |
| MAexp50: | 1.2975 | |
| MAexp100: | 1.2959 | |
| Price / MA7: | +0.40% | |
| Price / MA20: | +1.64% | |
| Price / MA50: | +3.58% | |
| Price / MA100: | +3.01% | |
| Price / MAexp7: | +0.05% | |
| Price / MAexp20: | +0.12% | |
| Price / MAexp50: | +0.22% | |
| Price / MAexp100: | +0.35% |
News
Don't forget to follow the news on GBP/USD. At the time of publication of this analysis, the latest news was as follows:
-
 GBP/USD Analysis: Can the Dollar Recover from Here?
-
GBP/USD Analysis: Will the Pound Continue Higher?
-
GBP/USD Analysis: Is the Pound Getting Exhausted?
-
Technical Outlook on USDJPY, USDCAD, GBPUSD
-
GBP/USD Analysis: Can the Pound Break the Dollar?
About author

Online


Add a comment
Comments
0 comments on the analysis GBP/USD - 1H