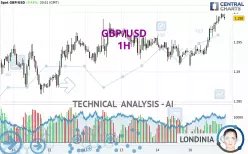
GBP/USD - 1H - Technical analysis published on 03/17/2025 (GMT)
- 119
- 0
- Timeframe : 1H
- - Analysis generated on
- Status : IN PROGRESS...

Summary of the analysis

Additional analysis
Quotes
GBP/USD rating 1.2990 USD. On the day, this instrument gained +0.43% and was between 1.2910 USD and 1.2999 USD. This implies that the price is at +0.62% from its lowest and at -0.07% from its highest.A bearish gap was detected at the opening by the Central Gaps scanner. There are a lot of sellers and they have the upper hand in the very short term.
Opening Gap DOWN
Type : Bearish
Timeframe : Openning
So that you have an overall view of the price change, here is a table showing the variations over several periods:
Technical
A technical analysis in 1H of this GBP/USD chart shows a strongly bullish trend. 89.29% of the signals given by moving averages are bullish. The overall trend is supported by the strong bullish signals from short-term moving averages. The Central Indicators market scanner currently does not detect any result that concerns moving averages.
The probability of a further increase is high given the direction of the technical indicators.
Caution: the Central Indicators scanner currently detects an excess:
RSI indicator is overbought : over 70
Type : Neutral
Timeframe : 1 hour
Williams %R indicator is overbought : over -20
Type : Neutral
Timeframe : 1 hour
Pivot points : price is over resistance 2 (Daily)
Type : Neutral
Timeframe : 1 hour
Pivot points : price is over resistance 1 (Weekly)
Type : Neutral
Timeframe : 1 hour
An analysis of the price chart with the Central Patterns scanner (detector of chart patterns and resistances and supports) shows several results that can have an impact on the price change:
Near horizontal resistance
Type : Bearish
Timeframe : 1 hour
Resistance of channel is broken
Type : Bullish
Timeframe : 1 hour
No result was found by the Central Candlesticks scanner on Japanese candlesticks.
| S3 | S2 | S1 | Price | R1 | R2 | R3 | |
|---|---|---|---|---|---|---|---|
| ProTrendLines | 1.2946 | 1.2967 | 1.2989 | 1.2990 | 1.3128 | 1.3255 | 1.3423 |
| Change (%) | -0.34% | -0.18% | -0.01% | - | +1.06% | +2.04% | +3.33% |
| Change | -0.0044 | -0.0023 | -0.0001 | - | +0.0138 | +0.0265 | +0.0433 |
| Level | Intermediate | Minor | Minor | - | Major | Minor | Major |
Attention could also be paid to pivot points to set price objectives:
| Pivot points | S3 | S2 | S1 | PP | R1 | R2 | R3 |
|---|---|---|---|---|---|---|---|
| Standard | 1.2862 | 1.2887 | 1.2910 | 1.2935 | 1.2958 | 1.2983 | 1.3006 |
| Camarilla | 1.2921 | 1.2925 | 1.2930 | 1.2934 | 1.2938 | 1.2943 | 1.2947 |
| Woodie | 1.2862 | 1.2887 | 1.2910 | 1.2935 | 1.2958 | 1.2983 | 1.3006 |
| Fibonacci | 1.2887 | 1.2905 | 1.2916 | 1.2935 | 1.2953 | 1.2964 | 1.2983 |
| Pivot points | S3 | S2 | S1 | PP | R1 | R2 | R3 |
|---|---|---|---|---|---|---|---|
| Standard | 1.2739 | 1.2800 | 1.2867 | 1.2928 | 1.2995 | 1.3056 | 1.3123 |
| Camarilla | 1.2899 | 1.2911 | 1.2922 | 1.2934 | 1.2946 | 1.2958 | 1.2969 |
| Woodie | 1.2742 | 1.2802 | 1.2870 | 1.2930 | 1.2998 | 1.3058 | 1.3126 |
| Fibonacci | 1.2800 | 1.2849 | 1.2879 | 1.2928 | 1.2977 | 1.3007 | 1.3056 |
| Pivot points | S3 | S2 | S1 | PP | R1 | R2 | R3 |
|---|---|---|---|---|---|---|---|
| Standard | 1.1845 | 1.2047 | 1.2312 | 1.2514 | 1.2779 | 1.2981 | 1.3246 |
| Camarilla | 1.2449 | 1.2491 | 1.2534 | 1.2577 | 1.2620 | 1.2663 | 1.2705 |
| Woodie | 1.1877 | 1.2063 | 1.2344 | 1.2530 | 1.2811 | 1.2997 | 1.3278 |
| Fibonacci | 1.2047 | 1.2225 | 1.2336 | 1.2514 | 1.2692 | 1.2803 | 1.2981 |
Numerical data
The following are the details of the technical indicators and moving averages that were collected to generate this technical analysis:
| RSI (14): | 74.63 | |
| MACD (12,26,9): | 0.0016 | |
| Directional Movement: | 14.3694 | |
| AROON (14): | 85.7143 | |
| DEMA (21): | 1.2988 | |
| Parabolic SAR (0,02-0,02-0,2): | 1.2977 | |
| Elder Ray (13): | 0.0014 | |
| Super Trend (3,10): | 1.2956 | |
| Zig ZAG (10): | 1.2995 | |
| VORTEX (21): | 1.2302 | |
| Stochastique (14,3,5): | 93.39 | |
| TEMA (21): | 1.2999 | |
| Williams %R (14): | -7.14 | |
| Chande Momentum Oscillator (20): | 0.0052 | |
| Repulse (5,40,3): | 0.0417 | |
| ROCnROLL: | 1 | |
| TRIX (15,9): | 0.0133 | |
| Courbe Coppock: | 0.83 |
| MA7: | 1.2941 | |
| MA20: | 1.2775 | |
| MA50: | 1.2544 | |
| MA100: | 1.2623 | |
| MAexp7: | 1.2988 | |
| MAexp20: | 1.2970 | |
| MAexp50: | 1.2955 | |
| MAexp100: | 1.2941 | |
| Price / MA7: | +0.38% | |
| Price / MA20: | +1.68% | |
| Price / MA50: | +3.56% | |
| Price / MA100: | +2.91% | |
| Price / MAexp7: | +0.02% | |
| Price / MAexp20: | +0.15% | |
| Price / MAexp50: | +0.27% | |
| Price / MAexp100: | +0.38% |
News
The last news published on GBP/USD at the time of the generation of this analysis was as follows:
-
 GBP/USD Analysis: Can the Dollar Recover from Here?
-
GBP/USD Analysis: Will the Pound Continue Higher?
-
GBP/USD Analysis: Is the Pound Getting Exhausted?
-
Technical Outlook on USDJPY, USDCAD, GBPUSD
-
GBP/USD Analysis: Can the Pound Break the Dollar?
About author

Online


Add a comment
Comments
0 comments on the analysis GBP/USD - 1H