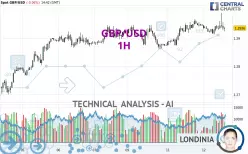
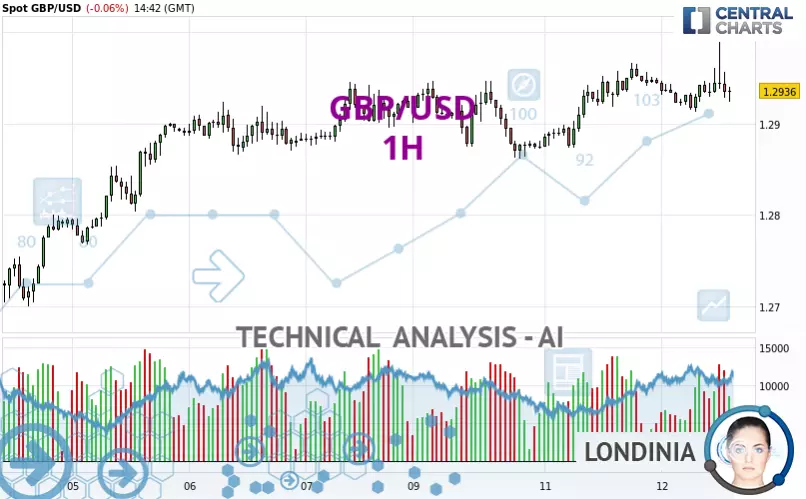
GBP/USD - 1H - Technical analysis published on 03/12/2025 (GMT)
- 46
- 0
- Timeframe : 1H
- - Analysis generated on
- Status : IN PROGRESS...
Summary of the analysis

Additional analysis
Quotes
GBP/USD rating 1.2936 USD. The price is lower by -0.06% since the last closing and was between 1.2913 USD and 1.2989 USD. This implies that the price is at +0.18% from its lowest and at -0.41% from its highest.Here is a more detailed summary of the historical variations registered by GBP/USD:
Near a new HIGH record (1 year)
Type : Bullish
Timeframe : Weekly
New HIGH record (1st january)
Type : Bullish
Timeframe : Weekly
New HIGH record (1 month)
Type : Bullish
Timeframe : Weekly
Technical
Technical analysis of this 1H chart of GBP/USD indicates that the overall trend is strongly bullish. 82.14% of the signals given by moving averages are bullish. The slightly bullish signals given by the short-term moving averages show a weakening of the global trend. There is no crossing of moving average by the price or crossing of moving averages between themselves.
The technical indicators are generally neutral. They do not provide relevant information on the direction of future price movements.
Other results related to technical indicators were also found by the Central Indicators scanner:
RSI indicator is back under 50
Type : Bearish
Timeframe : 1 hour
Price is back under the pivot point (Daily)
Type : Bearish
Timeframe : 1 hour
An analysis of the price chart with the Central Patterns scanner (detector of chart patterns and resistances and supports) shows several results that can have an impact on the price change:
Near horizontal support
Type : Bullish
Timeframe : 1 hour
Support of channel is broken
Type : Bearish
Timeframe : 1 hour
The Central Candlesticks scanner which studies Japanese candlesticks did not detect anything.
| S3 | S2 | S1 | Price | R1 | R2 | R3 | |
|---|---|---|---|---|---|---|---|
| ProTrendLines | 1.2684 | 1.2824 | 1.2863 | 1.2936 | 1.2946 | 1.3128 | 1.3255 |
| Change (%) | -1.95% | -0.87% | -0.56% | - | +0.08% | +1.48% | +2.47% |
| Change | -0.0252 | -0.0112 | -0.0073 | - | +0.0010 | +0.0192 | +0.0319 |
| Level | Major | Major | Major | - | Intermediate | Major | Minor |
Pivot points can also be used to set your price objectives. Here is the price situation in relation to pivot points:
| Pivot points | S3 | S2 | S1 | PP | R1 | R2 | R3 |
|---|---|---|---|---|---|---|---|
| Standard | 1.2796 | 1.2835 | 1.2889 | 1.2928 | 1.2982 | 1.3021 | 1.3075 |
| Camarilla | 1.2918 | 1.2927 | 1.2936 | 1.2944 | 1.2953 | 1.2961 | 1.2970 |
| Woodie | 1.2805 | 1.2839 | 1.2898 | 1.2932 | 1.2991 | 1.3025 | 1.3084 |
| Fibonacci | 1.2835 | 1.2870 | 1.2892 | 1.2928 | 1.2963 | 1.2985 | 1.3021 |
| Pivot points | S3 | S2 | S1 | PP | R1 | R2 | R3 |
|---|---|---|---|---|---|---|---|
| Standard | 1.2306 | 1.2440 | 1.2678 | 1.2812 | 1.3050 | 1.3184 | 1.3422 |
| Camarilla | 1.2815 | 1.2849 | 1.2883 | 1.2917 | 1.2951 | 1.2985 | 1.3019 |
| Woodie | 1.2359 | 1.2466 | 1.2731 | 1.2838 | 1.3103 | 1.3210 | 1.3475 |
| Fibonacci | 1.2440 | 1.2582 | 1.2670 | 1.2812 | 1.2954 | 1.3042 | 1.3184 |
| Pivot points | S3 | S2 | S1 | PP | R1 | R2 | R3 |
|---|---|---|---|---|---|---|---|
| Standard | 1.1845 | 1.2047 | 1.2312 | 1.2514 | 1.2779 | 1.2981 | 1.3246 |
| Camarilla | 1.2449 | 1.2491 | 1.2534 | 1.2577 | 1.2620 | 1.2663 | 1.2705 |
| Woodie | 1.1877 | 1.2063 | 1.2344 | 1.2530 | 1.2811 | 1.2997 | 1.3278 |
| Fibonacci | 1.2047 | 1.2225 | 1.2336 | 1.2514 | 1.2692 | 1.2803 | 1.2981 |
Numerical data
The following is the status of technical indicators and moving averages registered at the time this technical analysis was created:
| RSI (14): | 53.66 | |
| MACD (12,26,9): | 0.0004 | |
| Directional Movement: | 17.1338 | |
| AROON (14): | 35.7142 | |
| DEMA (21): | 1.2941 | |
| Parabolic SAR (0,02-0,02-0,2): | 1.2917 | |
| Elder Ray (13): | 0.0010 | |
| Super Trend (3,10): | 1.2906 | |
| Zig ZAG (10): | 1.2939 | |
| VORTEX (21): | 1.0000 | |
| Stochastique (14,3,5): | 44.33 | |
| TEMA (21): | 1.2936 | |
| Williams %R (14): | -77.63 | |
| Chande Momentum Oscillator (20): | -0.0008 | |
| Repulse (5,40,3): | -0.3380 | |
| ROCnROLL: | -1 | |
| TRIX (15,9): | 0.0050 | |
| Courbe Coppock: | 0.14 |
| MA7: | 1.2891 | |
| MA20: | 1.2719 | |
| MA50: | 1.2512 | |
| MA100: | 1.2623 | |
| MAexp7: | 1.2936 | |
| MAexp20: | 1.2935 | |
| MAexp50: | 1.2924 | |
| MAexp100: | 1.2899 | |
| Price / MA7: | +0.35% | |
| Price / MA20: | +1.71% | |
| Price / MA50: | +3.39% | |
| Price / MA100: | +2.48% | |
| Price / MAexp7: | -0% | |
| Price / MAexp20: | +0.01% | |
| Price / MAexp50: | +0.09% | |
| Price / MAexp100: | +0.29% |
News
The last news published on GBP/USD at the time of the generation of this analysis was as follows:
-
 GBP/USD Analysis: Will the Pound Continue Higher?
-
GBP/USD Analysis: Is the Pound Getting Exhausted?
-
Technical Outlook on USDJPY, USDCAD, GBPUSD
-
GBP/USD Analysis: Can the Pound Break the Dollar?
-
GBP/USD Analysis: The Pound Settles Down on Friday
About author

Online


Add a comment
Comments
0 comments on the analysis GBP/USD - 1H