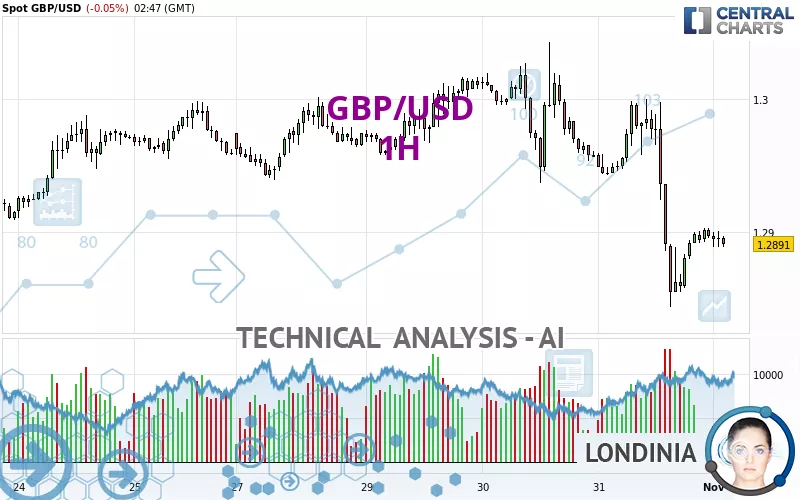
GBP/USD - 1H - Technical analysis published on 11/01/2024 (GMT)
- 330
- 0
Click here for a new analysis!
- Timeframe : 1H
- - Analysis generated on
- Status : INVALID

Summary of the analysis

Additional analysis
Quotes
The GBP/USD rating is 1.2891 USD. On the day, this instrument lost -0.05% and was between 1.2889 USD and 1.2901 USD. This implies that the price is at +0.02% from its lowest and at -0.08% from its highest.A study of price movements over other periods shows the following variations:
Near a new LOW record (1 year)
Type : Bearish
Timeframe : Weekly
Near a new LOW record (1st january)
Type : Bearish
Timeframe : Weekly
Near a new HIGH record (1 month)
Type : Bullish
Timeframe : Weekly
Technical
A technical analysis in 1H of this GBP/USD chart shows a sharp bearish trend. The signals given by moving averages are 92.86% bearish. This strong bearish trend is confirmed by the strong signals currently being given by short-term moving averages. The Central Indicators scanner does not detect any result on moving averages that would impact this trend.
Technical indicators are slightly bearish. There is therefore considerable uncertainty about the continuation of the decline.
Central Indicators, the scanner specialised in technical indicators, has identified these signals:
Pivot points : price is under support 1
Type : Neutral
Timeframe : Weekly
Momentum indicator is back over 0
Type : Bullish
Timeframe : 1 hour
The Central Patterns scanner, which studies chart patterns, resistances and supports, has identified these signals:
Near horizontal support
Type : Bullish
Timeframe : 1 hour
Support of channel is broken
Type : Bearish
Timeframe : 1 hour
The Central Candlesticks scanner which studies Japanese candlesticks did not detect anything.
| S3 | S2 | S1 | Price | R1 | R2 | R3 | |
|---|---|---|---|---|---|---|---|
| ProTrendLines | 1.2561 | 1.2681 | 1.2833 | 1.2891 | 1.2907 | 1.2938 | 1.2999 |
| Change (%) | -2.56% | -1.63% | -0.45% | - | +0.12% | +0.36% | +0.84% |
| Change | -0.0330 | -0.0210 | -0.0058 | - | +0.0016 | +0.0047 | +0.0108 |
| Level | Minor | Major | Major | - | Minor | Intermediate | Intermediate |
Attention could also be paid to pivot points to set price objectives:
| Pivot points | S3 | S2 | S1 | PP | R1 | R2 | R3 |
|---|---|---|---|---|---|---|---|
| Standard | 1.2671 | 1.2758 | 1.2827 | 1.2914 | 1.2983 | 1.3070 | 1.3139 |
| Camarilla | 1.2854 | 1.2868 | 1.2883 | 1.2897 | 1.2911 | 1.2926 | 1.2940 |
| Woodie | 1.2663 | 1.2754 | 1.2819 | 1.2910 | 1.2975 | 1.3066 | 1.3131 |
| Fibonacci | 1.2758 | 1.2817 | 1.2854 | 1.2914 | 1.2973 | 1.3010 | 1.3070 |
| Pivot points | S3 | S2 | S1 | PP | R1 | R2 | R3 |
|---|---|---|---|---|---|---|---|
| Standard | 1.2741 | 1.2824 | 1.2892 | 1.2975 | 1.3043 | 1.3126 | 1.3194 |
| Camarilla | 1.2919 | 1.2932 | 1.2946 | 1.2960 | 1.2974 | 1.2988 | 1.3002 |
| Woodie | 1.2734 | 1.2820 | 1.2885 | 1.2971 | 1.3036 | 1.3122 | 1.3187 |
| Fibonacci | 1.2824 | 1.2882 | 1.2917 | 1.2975 | 1.3033 | 1.3068 | 1.3126 |
| Pivot points | S3 | S2 | S1 | PP | R1 | R2 | R3 |
|---|---|---|---|---|---|---|---|
| Standard | 1.2151 | 1.2498 | 1.2697 | 1.3044 | 1.3243 | 1.3590 | 1.3789 |
| Camarilla | 1.2747 | 1.2797 | 1.2847 | 1.2897 | 1.2947 | 1.2997 | 1.3047 |
| Woodie | 1.2078 | 1.2461 | 1.2624 | 1.3007 | 1.3170 | 1.3553 | 1.3716 |
| Fibonacci | 1.2498 | 1.2706 | 1.2835 | 1.3044 | 1.3252 | 1.3381 | 1.3590 |
Numerical data
The following is the status of the technical indicators and moving averages at the time of publication of this technical analysis:
| RSI (14): | 38.83 | |
| MACD (12,26,9): | -0.0019 | |
| Directional Movement: | -12.4201 | |
| AROON (14): | -14.2857 | |
| DEMA (21): | 1.2885 | |
| Parabolic SAR (0,02-0,02-0,2): | 1.2942 | |
| Elder Ray (13): | -0.0008 | |
| Super Trend (3,10): | 1.2946 | |
| Zig ZAG (10): | 1.2891 | |
| VORTEX (21): | 0.8806 | |
| Stochastique (14,3,5): | 32.47 | |
| TEMA (21): | 1.2880 | |
| Williams %R (14): | -69.48 | |
| Chande Momentum Oscillator (20): | 0.0000 | |
| Repulse (5,40,3): | -0.0201 | |
| ROCnROLL: | 2 | |
| TRIX (15,9): | -0.0239 | |
| Courbe Coppock: | 0.97 |
| MA7: | 1.2952 | |
| MA20: | 1.3005 | |
| MA50: | 1.3128 | |
| MA100: | 1.2978 | |
| MAexp7: | 1.2895 | |
| MAexp20: | 1.2912 | |
| MAexp50: | 1.2940 | |
| MAexp100: | 1.2957 | |
| Price / MA7: | -0.47% | |
| Price / MA20: | -0.88% | |
| Price / MA50: | -1.81% | |
| Price / MA100: | -0.67% | |
| Price / MAexp7: | -0.03% | |
| Price / MAexp20: | -0.16% | |
| Price / MAexp50: | -0.38% | |
| Price / MAexp100: | -0.51% |
News
The latest news and videos published on GBP/USD at the time of the analysis were as follows:
-
 GBP/USD Forecast October 31, 2024
-
Going long GBP/USD as it recovers from recent weakness
-
GBP/USD Forecast October 24, 2024
-
GBP/USD Forecast October 22, 2024
-
GBP/USD Forecast October 17, 2024
About author

Online


Add a comment
Comments
0 comments on the analysis GBP/USD - 1H