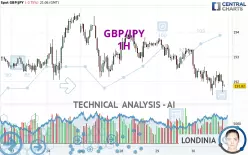
GBP/JPY - 1H - Technical analysis published on 01/30/2025 (GMT)
- 135
- 0
Click here for a new analysis!
- Timeframe : 1H
- - Analysis generated on
- Status : LEVEL MAINTAINED

Summary of the analysis

Additional analysis
Quotes
The GBP/JPY price is 191.82 JPY. On the day, this instrument lost -0.75% with the lowest point at 191.45 JPY and the highest point at 193.30 JPY. The deviation from the price is +0.19% for the low point and -0.77% for the high point.Here is a more detailed summary of the historical variations registered by GBP/JPY:
Near a new HIGH record (1st january)
Type : Bullish
Timeframe : Weekly
Near a new HIGH record (1 month)
Type : Bullish
Timeframe : Weekly
Technical
Technical analysis of this 1H chart of GBP/JPY indicates that the overall trend is strongly bearish. The signals given by moving averages are 92.86% bearish. This strong bearish trend is confirmed by the strong signals currently being given by short-term moving averages. The Central Indicators market scanner currently does not detect any result that concerns moving averages.
On the 18 technical indicators analysed, 4 are bullish, 7 are neutral and 7 are bearish. Caution: the Central Indicators scanner currently detects an excess:
CCI indicator is oversold : under -100
Type : Neutral
Timeframe : 1 hour
Pivot points : price is under support 3
Type : Neutral
Timeframe : 1 hour
Price is back under the pivot point
Type : Bearish
Timeframe : Weekly
An analysis of the price chart with the Central Patterns scanner (detector of chart patterns and resistances and supports) shows several results that can have an impact on the price change:
Near horizontal support
Type : Bullish
Timeframe : 1 hour
Support of channel is broken
Type : Bearish
Timeframe : 1 hour
The Central Candlesticks scanner, specialised in Japanese candlesticks, did not identify any signals.
| S3 | S2 | S1 | Price | R1 | R2 | R3 | |
|---|---|---|---|---|---|---|---|
| ProTrendLines | 189.89 | 190.48 | 191.14 | 191.82 | 191.93 | 193.00 | 193.75 |
| Change (%) | -1.01% | -0.70% | -0.35% | - | +0.06% | +0.62% | +1.01% |
| Change | -1.93 | -1.34 | -0.68 | - | +0.11 | +1.18 | +1.93 |
| Level | Minor | Minor | Minor | - | Intermediate | Intermediate | Intermediate |
Pivot points can also be used to set your price objectives. Here is the price situation in relation to pivot points:
| Pivot points | S3 | S2 | S1 | PP | R1 | R2 | R3 |
|---|---|---|---|---|---|---|---|
| Standard | 191.32 | 191.90 | 192.59 | 193.17 | 193.86 | 194.44 | 195.13 |
| Camarilla | 192.92 | 193.04 | 193.15 | 193.27 | 193.39 | 193.50 | 193.62 |
| Woodie | 191.37 | 191.93 | 192.64 | 193.20 | 193.91 | 194.47 | 195.18 |
| Fibonacci | 191.90 | 192.39 | 192.69 | 193.17 | 193.66 | 193.96 | 194.44 |
| Pivot points | S3 | S2 | S1 | PP | R1 | R2 | R3 |
|---|---|---|---|---|---|---|---|
| Standard | 186.60 | 188.24 | 191.47 | 193.11 | 196.34 | 197.98 | 201.21 |
| Camarilla | 193.35 | 193.80 | 194.24 | 194.69 | 195.14 | 195.58 | 196.03 |
| Woodie | 187.39 | 188.64 | 192.26 | 193.51 | 197.13 | 198.38 | 202.00 |
| Fibonacci | 188.24 | 190.10 | 191.25 | 193.11 | 194.97 | 196.12 | 197.98 |
| Pivot points | S3 | S2 | S1 | PP | R1 | R2 | R3 |
|---|---|---|---|---|---|---|---|
| Standard | 179.40 | 183.75 | 190.27 | 194.62 | 201.14 | 205.49 | 212.01 |
| Camarilla | 193.81 | 194.81 | 195.80 | 196.80 | 197.80 | 198.79 | 199.79 |
| Woodie | 180.50 | 184.29 | 191.37 | 195.16 | 202.24 | 206.03 | 213.11 |
| Fibonacci | 183.75 | 187.90 | 190.46 | 194.62 | 198.77 | 201.33 | 205.49 |
Numerical data
The following are the details of the technical indicators and moving averages that were collected to generate this technical analysis:
| RSI (14): | 42.27 | |
| MACD (12,26,9): | -0.2100 | |
| Directional Movement: | -12.96 | |
| AROON (14): | -35.71 | |
| DEMA (21): | 191.96 | |
| Parabolic SAR (0,02-0,02-0,2): | 191.53 | |
| Elder Ray (13): | -0.18 | |
| Super Trend (3,10): | 192.75 | |
| Zig ZAG (10): | 192.01 | |
| VORTEX (21): | 0.8400 | |
| Stochastique (14,3,5): | 52.75 | |
| TEMA (21): | 191.90 | |
| Williams %R (14): | -67.83 | |
| Chande Momentum Oscillator (20): | -0.58 | |
| Repulse (5,40,3): | -0.2300 | |
| ROCnROLL: | 2 | |
| TRIX (15,9): | -0.0200 | |
| Courbe Coppock: | 0.35 |
| MA7: | 193.09 | |
| MA20: | 193.25 | |
| MA50: | 193.77 | |
| MA100: | 194.02 | |
| MAexp7: | 192.01 | |
| MAexp20: | 192.25 | |
| MAexp50: | 192.62 | |
| MAexp100: | 192.78 | |
| Price / MA7: | -0.66% | |
| Price / MA20: | -0.74% | |
| Price / MA50: | -1.01% | |
| Price / MA100: | -1.13% | |
| Price / MAexp7: | -0.10% | |
| Price / MAexp20: | -0.22% | |
| Price / MAexp50: | -0.42% | |
| Price / MAexp100: | -0.50% |
News
The last news published on GBP/JPY at the time of the generation of this analysis was as follows:
-
 GBP/JPY Pirce Forecast - Dragon Continues to Consolidate
-
GBP/JPY Price Forecast - Sterling Races Higher After BoJ and PMI
-
GBP/JPY Price Forecast Can GBP Break 200 JPY? (January 8, 2025 Forecast)
-
GBP/JPY Forecast - Will "The Dragon Roar?" (December 26, 2024)
-
GBP/JPY Forecast November 26, 2024
About author

Online


Add a comment
Comments
0 comments on the analysis GBP/JPY - 1H