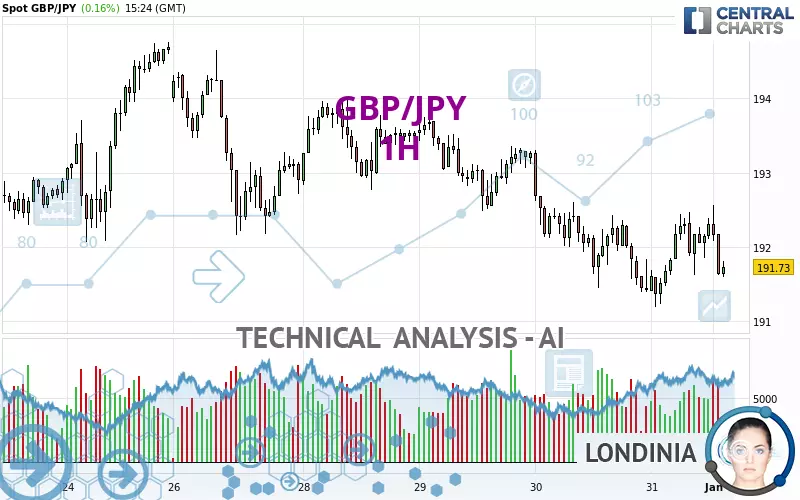
GBP/JPY - 1H - Technical analysis published on 01/31/2025 (GMT)
- 222
- 0
Click here for a new analysis!
- Timeframe : 1H
- - Analysis generated on
- Status : INVALID

Summary of the analysis

Additional analysis
Quotes
The GBP/JPY price is 191.73 JPY. The price registered an increase of +0.16% on the session and was traded between 191.19 JPY and 192.56 JPY over the period. The price is currently at +0.28% from its lowest and -0.43% from its highest.The Central Gaps scanner detects a bearish opening marking the presence of sellers ahead of buyers at the opening but not sufficiently marked to allow the price to register a quotation gap.
Bearish opening
Type : Bearish
Timeframe : Openning
Here is a more detailed summary of the historical variations registered by GBP/JPY:
Near a new HIGH record (1st january)
Type : Bullish
Timeframe : Weekly
Near a new HIGH record (1 month)
Type : Bullish
Timeframe : Weekly
Technical
A technical analysis in 1H of this GBP/JPY chart shows a sharp bearish trend. The signals given by moving averages are 92.86% bearish. This strong bearish trend is confirmed by the strong signals currently being given by short-term moving averages. The Central Indicators market scanner is currently detecting several bearish signals that could impact this trend:
Bearish trend reversal : Moving Average 20
Type : Bearish
Timeframe : 1 hour
Bearish trend reversal : adaptative moving average 20
Type : Bearish
Timeframe : 1 hour
In fact, Central Analyzer took into account 18 technical indicators and the result was as follows: 6 are bullish, 6 are neutral and 6 are bearish. Central Indicators, the scanner specialised in technical indicators, has identified this signal:
Price is back under the pivot point
Type : Bearish
Timeframe : Weekly
An analysis of the price chart with the Central Patterns scanner (detector of chart patterns and resistances and supports) shows several results that can have an impact on the price change:
Near horizontal resistance
Type : Bearish
Timeframe : 1 hour
Near resistance of triangle
Type : Bearish
Timeframe : 1 hour
Resistance of channel is broken
Type : Bullish
Timeframe : 1 hour
No result was found by the Central Candlesticks scanner on Japanese candlesticks.
| S3 | S2 | S1 | Price | R1 | R2 | R3 | |
|---|---|---|---|---|---|---|---|
| ProTrendLines | 189.27 | 190.48 | 191.45 | 191.73 | 192.07 | 193.01 | 194.03 |
| Change (%) | -1.28% | -0.65% | -0.15% | - | +0.18% | +0.67% | +1.20% |
| Change | -2.46 | -1.25 | -0.28 | - | +0.34 | +1.28 | +2.30 |
| Level | Intermediate | Minor | Intermediate | - | Intermediate | Intermediate | Minor |
Pivot points can also be used to set your price objectives. Here is the price situation in relation to pivot points:
| Pivot points | S3 | S2 | S1 | PP | R1 | R2 | R3 |
|---|---|---|---|---|---|---|---|
| Standard | 188.86 | 190.13 | 190.77 | 192.04 | 192.68 | 193.95 | 194.59 |
| Camarilla | 190.90 | 191.07 | 191.25 | 191.42 | 191.60 | 191.77 | 191.95 |
| Woodie | 188.56 | 189.97 | 190.47 | 191.88 | 192.38 | 193.79 | 194.29 |
| Fibonacci | 190.13 | 190.86 | 191.31 | 192.04 | 192.77 | 193.22 | 193.95 |
| Pivot points | S3 | S2 | S1 | PP | R1 | R2 | R3 |
|---|---|---|---|---|---|---|---|
| Standard | 186.60 | 188.24 | 191.47 | 193.11 | 196.34 | 197.98 | 201.21 |
| Camarilla | 193.35 | 193.80 | 194.24 | 194.69 | 195.14 | 195.58 | 196.03 |
| Woodie | 187.39 | 188.64 | 192.26 | 193.51 | 197.13 | 198.38 | 202.00 |
| Fibonacci | 188.24 | 190.10 | 191.25 | 193.11 | 194.97 | 196.12 | 197.98 |
| Pivot points | S3 | S2 | S1 | PP | R1 | R2 | R3 |
|---|---|---|---|---|---|---|---|
| Standard | 179.40 | 183.75 | 190.27 | 194.62 | 201.14 | 205.49 | 212.01 |
| Camarilla | 193.81 | 194.81 | 195.80 | 196.80 | 197.80 | 198.79 | 199.79 |
| Woodie | 180.50 | 184.29 | 191.37 | 195.16 | 202.24 | 206.03 | 213.11 |
| Fibonacci | 183.75 | 187.90 | 190.46 | 194.62 | 198.77 | 201.33 | 205.49 |
Numerical data
The following are the details of the technical indicators and moving averages that were collected to generate this technical analysis:
| RSI (14): | 44.29 | |
| MACD (12,26,9): | -0.0600 | |
| Directional Movement: | -8.60 | |
| AROON (14): | 85.71 | |
| DEMA (21): | 191.88 | |
| Parabolic SAR (0,02-0,02-0,2): | 192.56 | |
| Elder Ray (13): | -0.26 | |
| Super Trend (3,10): | 192.48 | |
| Zig ZAG (10): | 191.72 | |
| VORTEX (21): | 0.9400 | |
| Stochastique (14,3,5): | 47.58 | |
| TEMA (21): | 191.99 | |
| Williams %R (14): | -64.66 | |
| Chande Momentum Oscillator (20): | 0.03 | |
| Repulse (5,40,3): | -0.2200 | |
| ROCnROLL: | 2 | |
| TRIX (15,9): | -0.0100 | |
| Courbe Coppock: | 0.40 |
| MA7: | 192.91 | |
| MA20: | 193.04 | |
| MA50: | 193.66 | |
| MA100: | 194.08 | |
| MAexp7: | 191.94 | |
| MAexp20: | 191.98 | |
| MAexp50: | 192.23 | |
| MAexp100: | 192.49 | |
| Price / MA7: | -0.61% | |
| Price / MA20: | -0.68% | |
| Price / MA50: | -1.00% | |
| Price / MA100: | -1.21% | |
| Price / MAexp7: | -0.11% | |
| Price / MAexp20: | -0.13% | |
| Price / MAexp50: | -0.26% | |
| Price / MAexp100: | -0.39% |
News
The latest news and videos published on GBP/JPY at the time of the analysis were as follows:
-
 GBP/JPY Pirce Forecast - Dragon Continues to Consolidate
-
GBP/JPY Price Forecast - Sterling Races Higher After BoJ and PMI
-
GBP/JPY Price Forecast Can GBP Break 200 JPY? (January 8, 2025 Forecast)
-
GBP/JPY Forecast - Will "The Dragon Roar?" (December 26, 2024)
-
GBP/JPY Forecast November 26, 2024
About author

Online


Add a comment
Comments
0 comments on the analysis GBP/JPY - 1H