| Open: | 164.69 |
| Change: | +0.27 |
| Volume: | 8,065,838 |
| Low: | 164.32 |
| High: | 166.43 |
| High / Low range: | 2.11 |
| Type: | Forex |
| Ticker: | GBPAUD |
| ISIN: |
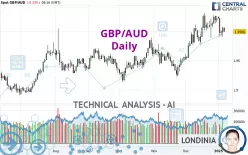
GBP/AUD - Daily - Technical analysis published on 01/07/2025 (GMT)
- 200
- 0
- 01/07/2025 - 08:16
Click here for a new analysis!
- Timeframe : Daily
- - Analysis generated on 01/07/2025 - 08:16
- Status : INVALID

Summary of the analysis

Additional analysis
Quotes
The GBP/AUD price is 1.9986 AUD. The price is lower by -0.33% since the last closing and was between 1.9986 AUD and 2.0054 AUD. This implies that the price is at 0% from its lowest and at -0.34% from its highest.A study of price movements over other periods shows the following variations:
Near a new HIGH record (5 years)
Type : Bullish
Timeframe : Weekly
Near a new HIGH record (1 year)
Type : Bullish
Timeframe : Weekly
Near a new HIGH record (1st january)
Type : Bullish
Timeframe : Weekly
Near a new HIGH record (1 month)
Type : Bullish
Timeframe : Weekly
Technical
Technical analysis of GBP/AUD in Daily shows an overall bullish trend. The signals given by moving averages are 78.57% bullish. This bullish trend could slow down given the neutral signals currently being given by short-term moving averages. The Central Indicators market scanner is currently detecting a bearish signal that could impact this trend:
Bearish price crossover with Moving Average 20
Type : Bearish
Timeframe : Daily
An assessment of technical indicators does not currently provide any relevant information to suggest whether the signal given by the technical indicators is more bullish or bearish.
The Central Indicators scanner found this result concerning these indicators:
Price is back under the pivot point
Type : Bearish
Timeframe : Daily
Central Patterns, the scanner specializing in chart patterns, did not identify any signals.
The Central Candlesticks scanner, specialised in Japanese candlesticks, did not identify any signals.
| S3 | S2 | S1 | Price | R1 | R2 | R3 | |
|---|---|---|---|---|---|---|---|
| ProTrendLines | 1.9279 | 1.9664 | 1.9897 | 1.9986 | 2.0253 | 2.0483 | 2.2104 |
| Change (%) | -3.54% | -1.61% | -0.45% | - | +1.34% | +2.49% | +10.60% |
| Change | -0.0707 | -0.0322 | -0.0089 | - | +0.0267 | +0.0497 | +0.2118 |
| Level | Intermediate | Minor | Major | - | Major | Intermediate | Intermediate |
To determine price objectives, it is also possible to use the pivot points. Here is the price position in relation to pivot points:
| Pivot points | S3 | S2 | S1 | PP | R1 | R2 | R3 |
|---|---|---|---|---|---|---|---|
| Standard | 1.9774 | 1.9837 | 1.9945 | 2.0008 | 2.0116 | 2.0179 | 2.0287 |
| Camarilla | 2.0006 | 2.0022 | 2.0037 | 2.0053 | 2.0069 | 2.0084 | 2.0100 |
| Woodie | 1.9797 | 1.9848 | 1.9968 | 2.0019 | 2.0139 | 2.0190 | 2.0310 |
| Fibonacci | 1.9837 | 1.9902 | 1.9943 | 2.0008 | 2.0073 | 2.0114 | 2.0179 |
| Pivot points | S3 | S2 | S1 | PP | R1 | R2 | R3 |
|---|---|---|---|---|---|---|---|
| Standard | 1.9509 | 1.9712 | 1.9850 | 2.0053 | 2.0191 | 2.0394 | 2.0532 |
| Camarilla | 1.9893 | 1.9925 | 1.9956 | 1.9987 | 2.0018 | 2.0050 | 2.0081 |
| Woodie | 1.9476 | 1.9696 | 1.9817 | 2.0037 | 2.0158 | 2.0378 | 2.0499 |
| Fibonacci | 1.9712 | 1.9843 | 1.9923 | 2.0053 | 2.0184 | 2.0264 | 2.0394 |
| Pivot points | S3 | S2 | S1 | PP | R1 | R2 | R3 |
|---|---|---|---|---|---|---|---|
| Standard | 1.8916 | 1.9211 | 1.9711 | 2.0006 | 2.0506 | 2.0801 | 2.1301 |
| Camarilla | 1.9991 | 2.0064 | 2.0137 | 2.0210 | 2.0283 | 2.0356 | 2.0429 |
| Woodie | 1.9018 | 1.9262 | 1.9813 | 2.0057 | 2.0608 | 2.0852 | 2.1403 |
| Fibonacci | 1.9211 | 1.9515 | 1.9703 | 2.0006 | 2.0310 | 2.0498 | 2.0801 |
Numerical data
The following are the details of the technical indicators and moving averages that were collected to generate this technical analysis:
| RSI (14): | 53.03 | |
| MACD (12,26,9): | 0.0094 | |
| Directional Movement: | 1.6779 | |
| AROON (14): | 21.4286 | |
| DEMA (21): | 2.0139 | |
| Parabolic SAR (0,02-0,02-0,2): | 2.0246 | |
| Elder Ray (13): | -0.0018 | |
| Super Trend (3,10): | 1.9729 | |
| Zig ZAG (10): | 2.0013 | |
| VORTEX (21): | 1.0766 | |
| Stochastique (14,3,5): | 39.87 | |
| TEMA (21): | 2.0138 | |
| Williams %R (14): | -68.72 | |
| Chande Momentum Oscillator (20): | -0.0240 | |
| Repulse (5,40,3): | -0.0957 | |
| ROCnROLL: | -1 | |
| TRIX (15,9): | 0.0943 | |
| Courbe Coppock: | 1.20 |
| MA7: | 2.0090 | |
| MA20: | 2.0044 | |
| MA50: | 1.9763 | |
| MA100: | 1.9613 | |
| MAexp7: | 2.0054 | |
| MAexp20: | 1.9999 | |
| MAexp50: | 1.9821 | |
| MAexp100: | 1.9666 | |
| Price / MA7: | -0.52% | |
| Price / MA20: | -0.29% | |
| Price / MA50: | +1.13% | |
| Price / MA100: | +1.90% | |
| Price / MAexp7: | -0.34% | |
| Price / MAexp20: | -0.07% | |
| Price / MAexp50: | +0.83% | |
| Price / MAexp100: | +1.63% |
News
The latest news and videos published on GBP/AUD at the time of the analysis were as follows:
-
08/27/2024 - 16:27
 GBP/AUD Forecast August 28, 2024
-
10/07/2018 - 20:27
GBPAUD Clears 1.8500 Level
-
12/01/2017 - 01:21
Pound Pairs Breaking Critical Levels From GBP/USD to GBP/AUD (Quick Take Video)
-
12/07/2016 - 17:15
Volatility In Commodities GBP/AUD
-
10/13/2015 - 23:13
Risk on pressures GBPAUD
About author

Online


Add a comment
Comments
0 comments on the analysis GBP/AUD - Daily