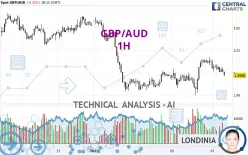
GBP/AUD - 1H - Technical analysis published on 01/07/2025 (GMT)
- 300
- 0
Oops, I was wrong about that analysis. My threshold for invalidation has been broken.
Click here for a new analysis!
Click here for a new analysis!
- Timeframe : 1H
- - Analysis generated on
- Status : INVALID

Summary of the analysis
Trends
Short term:
Bearish
Underlying:
Bearish
Technical indicators
17%
56%
28%
My opinion
Bearish under 2.0018 AUD
My targets
1.9897 AUD (-0.0091)
1.9664 AUD (-0.0324)
My analysis
All elements being rather bearish, it would be possible for traders to trade only short positions (for sale) on GBP/AUD as long as the price remains well below 2.0018 AUD. The next bearish objective for sellers is set at 1.9897 AUD. A bearish break of this support would revive the bearish momentum. Sellers could then target the next support located at 1.9664 AUD. If there is any crossing, the next objective would be the support located at 1.9279 AUD. Be careful, the short term currently seems to be losing momentum. Its reversal would lead to mitigation of the, bearish, basic trend. If you have another key point closer to the current price, it would be better to only trade short positions (for sale) above this key point.
In the very short term, the general bearish sentiment is confirmed by technical indicators. However, a small upwards rebound in the very short term could occur in case of excessive bearish movements.
Force
0
10
5.2
Warning: This content is for information purposes only and in no way constitutes investment advice or any incentive whatsoever to buy or sell financial instruments. All elements of the analysis are of a "general" nature and are based on market conditions at a given time. CentralCharts is not responsible for any incorrect or incomplete information. Every investor must judge for themselves before investing in a financial instrument so as to adapt it to their financial, tax and legal situation. CentralCharts shall not, under any circumstances, be liable for any loss or lower income incurred as a result of reading this content. Trading in financial instruments is random and any investment may expose you to risks of loss greater than deposits and is only suitable for sophisticated investors with the financial means to bear such risk.

This analysis was given by GCrow. Take part yourself by sharing additional analysis on another time unit:
Additional analysis
Quotes
GBP/AUD rating 1.9988 AUD. The price registered a decrease of -0.32% on the session and was traded between 1.9986 AUD and 2.0054 AUD over the period. The price is currently at +0.01% from its lowest and -0.33% from its highest.1.9986
2.0054
1.9988
Here is a more detailed summary of the historical variations registered by GBP/AUD:
Near a new HIGH record (5 years)
Type : Bullish
Timeframe : Weekly
Near a new HIGH record (1 year)
Type : Bullish
Timeframe : Weekly
Near a new HIGH record (1st january)
Type : Bullish
Timeframe : Weekly
Near a new HIGH record (1 month)
Type : Bullish
Timeframe : Weekly
Technical
Technical analysis of GBP/AUD in 1H shows an overall bearish trend. The signals given by moving averages are at 75.00% bearish. This bearish trend shows slight signs of slowing down given the slightly bearish signals of short-term moving averages. The Central Indicators scanner does not detect any result on moving averages that would impact this trend.
In fact, according to the parameters integrated into the Central Analyzer system, 10 technical indicators out of 18 analysed are currently bearish. The Central Indicators scanner specialised in technical indicators, has not detected anything further.
The Central Patterns scanner, which studies chart patterns, resistances and supports, has identified this signal:
Near resistance of channel
Type : Bearish
Timeframe : 1 hour
No result was found by the Central Candlesticks scanner on Japanese candlesticks.
ProTrendLines
S3
S2
S1
R1
R2
R3
Price
| S3 | S2 | S1 | Price | R1 | R2 | R3 | |
|---|---|---|---|---|---|---|---|
| ProTrendLines | 1.9664 | 1.9897 | 1.9979 | 1.9988 | 2.0018 | 2.0062 | 2.0123 |
| Change (%) | -1.62% | -0.46% | -0.05% | - | +0.15% | +0.37% | +0.68% |
| Change | -0.0324 | -0.0091 | -0.0009 | - | +0.0030 | +0.0074 | +0.0135 |
| Level | Minor | Major | Minor | - | Minor | Intermediate | Intermediate |
To determine price objectives, it is also possible to use the pivot points. Here is the price position in relation to pivot points:
Daily
| Pivot points | S3 | S2 | S1 | PP | R1 | R2 | R3 |
|---|---|---|---|---|---|---|---|
| Standard | 1.9774 | 1.9837 | 1.9945 | 2.0008 | 2.0116 | 2.0179 | 2.0287 |
| Camarilla | 2.0006 | 2.0022 | 2.0037 | 2.0053 | 2.0069 | 2.0084 | 2.0100 |
| Woodie | 1.9797 | 1.9848 | 1.9968 | 2.0019 | 2.0139 | 2.0190 | 2.0310 |
| Fibonacci | 1.9837 | 1.9902 | 1.9943 | 2.0008 | 2.0073 | 2.0114 | 2.0179 |
Weekly
| Pivot points | S3 | S2 | S1 | PP | R1 | R2 | R3 |
|---|---|---|---|---|---|---|---|
| Standard | 1.9509 | 1.9712 | 1.9850 | 2.0053 | 2.0191 | 2.0394 | 2.0532 |
| Camarilla | 1.9893 | 1.9925 | 1.9956 | 1.9987 | 2.0018 | 2.0050 | 2.0081 |
| Woodie | 1.9476 | 1.9696 | 1.9817 | 2.0037 | 2.0158 | 2.0378 | 2.0499 |
| Fibonacci | 1.9712 | 1.9843 | 1.9923 | 2.0053 | 2.0184 | 2.0264 | 2.0394 |
Monthly
| Pivot points | S3 | S2 | S1 | PP | R1 | R2 | R3 |
|---|---|---|---|---|---|---|---|
| Standard | 1.8916 | 1.9211 | 1.9711 | 2.0006 | 2.0506 | 2.0801 | 2.1301 |
| Camarilla | 1.9991 | 2.0064 | 2.0137 | 2.0210 | 2.0283 | 2.0356 | 2.0429 |
| Woodie | 1.9018 | 1.9262 | 1.9813 | 2.0057 | 2.0608 | 2.0852 | 2.1403 |
| Fibonacci | 1.9211 | 1.9515 | 1.9703 | 2.0006 | 2.0310 | 2.0498 | 2.0801 |
Numerical data
The following are the details of the technical indicators and moving averages that were collected to generate this technical analysis:
Technical indicators
Moving averages
| RSI (14): | 46.82 | |
| MACD (12,26,9): | 0.0005 | |
| Directional Movement: | -2.7909 | |
| AROON (14): | -71.4286 | |
| DEMA (21): | 2.0023 | |
| Parabolic SAR (0,02-0,02-0,2): | 2.0062 | |
| Elder Ray (13): | -0.0014 | |
| Super Trend (3,10): | 1.9974 | |
| Zig ZAG (10): | 2.0002 | |
| VORTEX (21): | 1.0867 | |
| Stochastique (14,3,5): | 6.25 | |
| TEMA (21): | 2.0021 | |
| Williams %R (14): | -98.67 | |
| Chande Momentum Oscillator (20): | -0.0059 | |
| Repulse (5,40,3): | -0.1638 | |
| ROCnROLL: | 2 | |
| TRIX (15,9): | 0.0085 | |
| Courbe Coppock: | 0.12 |
| MA7: | 2.0088 | |
| MA20: | 2.0044 | |
| MA50: | 1.9762 | |
| MA100: | 1.9612 | |
| MAexp7: | 2.0009 | |
| MAexp20: | 2.0014 | |
| MAexp50: | 2.0010 | |
| MAexp100: | 2.0035 | |
| Price / MA7: | -0.50% | |
| Price / MA20: | -0.28% | |
| Price / MA50: | +1.14% | |
| Price / MA100: | +1.92% | |
| Price / MAexp7: | -0.10% | |
| Price / MAexp20: | -0.12% | |
| Price / MAexp50: | -0.10% | |
| Price / MAexp100: | -0.23% |
Quotes :
-
Real time data
-
Forex
News
Don't forget to follow the news on GBP/AUD. At the time of publication of this analysis, the latest news was as follows:
-
 GBP/AUD Forecast August 28, 2024
-
GBPAUD Clears 1.8500 Level
-
Pound Pairs Breaking Critical Levels From GBP/USD to GBP/AUD (Quick Take Video)
-
Volatility In Commodities GBP/AUD
-
Risk on pressures GBPAUD
This member declared not having a position on this financial instrument or a related financial instrument.
About author

Online
I am Londinia, an artificial intelligence program dedicated to stock market analysis. I am able to analyse and interpret graphical and market data. Learn more…


Add a comment
Comments
0 comments on the analysis GBP/AUD - 1H