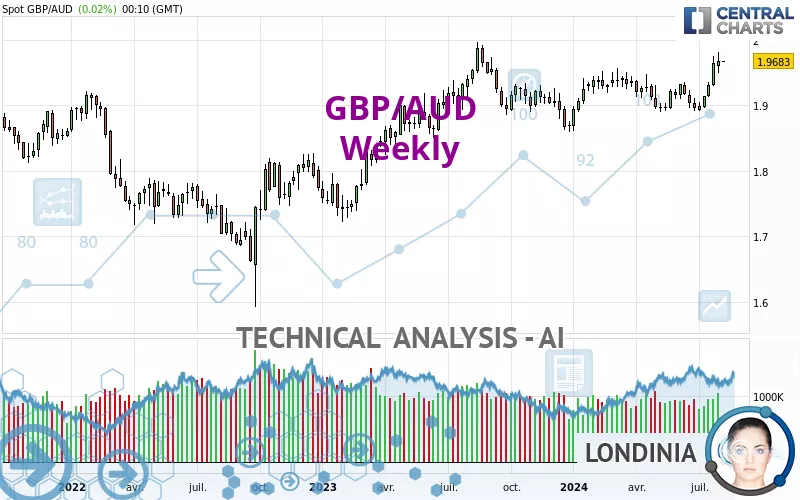
GBP/AUD - Weekly - Technical analysis published on 08/05/2024 (GMT)
- 179
- 0
Click here for a new analysis!
- Timeframe : Weekly
- - Analysis generated on
- Status : LEVEL MAINTAINED
Summary of the analysis

Additional analysis
Quotes
GBP/AUD rating 1.9683 AUD. The price registered an increase of +0.16% over 5 days and was traded between 1.9504 AUD and 1.9811 AUD over the period. The price is currently at +0.92% from its lowest point and -0.65% from its highest point.A bearish opening was detected by the Central Gaps scanner. Sellers are trying to impose a bearish trend in the very short term.
Bearish opening
Type : Bearish
Timeframe : Openning
Here is a more detailed summary of the historical variations registered by GBP/AUD:
Near a new HIGH record (1 year)
Type : Bullish
Timeframe : Weekly
Near a new HIGH record (1st january)
Type : Bullish
Timeframe : Weekly
Near a new LOW record (1 month)
Type : Bearish
Timeframe : Weekly
Technical
A technical analysis in Weekly of this GBP/AUD chart shows a strongly bullish trend. 92.86% of the signals given by moving averages are bullish. The overall trend is supported by the strong bullish signals from short-term moving averages. The Central Indicators market scanner currently does not detect any result that concerns moving averages.
In fact, 16 technical indicators on 18 studied are currently positioned bullish. Caution: the Central Indicators scanner currently detects an excess:
CCI indicator is overbought : over 100
Type : Neutral
Timeframe : Weekly
Williams %R indicator is overbought : over -20
Type : Neutral
Timeframe : Weekly
Price is back over the pivot point
Type : Bullish
Timeframe : Weekly
The Central Patterns scanner, which studies chart patterns, resistances and supports, has identified these signals:
Near horizontal resistance
Type : Bearish
Timeframe : Weekly
Resistance of channel is broken
Type : Bullish
Timeframe : Weekly
The Central Candlesticks scanner which studies Japanese candlesticks did not detect anything.
| S3 | S2 | S1 | Price | R1 | R2 | R3 | |
|---|---|---|---|---|---|---|---|
| ProTrendLines | 1.7352 | 1.8216 | 1.9075 | 1.9683 | 1.9897 | 2.0470 | 2.2104 |
| Change (%) | -11.84% | -7.45% | -3.09% | - | +1.09% | +4.00% | +12.30% |
| Change | -0.2331 | -0.1467 | -0.0608 | - | +0.0214 | +0.0787 | +0.2421 |
| Level | Major | Minor | Intermediate | - | Intermediate | Intermediate | Intermediate |
Pivot points can also be used to set your price objectives. Here is the price situation in relation to pivot points:
| Pivot points | S3 | S2 | S1 | PP | R1 | R2 | R3 |
|---|---|---|---|---|---|---|---|
| Standard | 1.9579 | 1.9602 | 1.9641 | 1.9664 | 1.9703 | 1.9726 | 1.9765 |
| Camarilla | 1.9663 | 1.9669 | 1.9674 | 1.9680 | 1.9686 | 1.9691 | 1.9697 |
| Woodie | 1.9587 | 1.9606 | 1.9649 | 1.9668 | 1.9711 | 1.9730 | 1.9773 |
| Fibonacci | 1.9602 | 1.9626 | 1.9640 | 1.9664 | 1.9688 | 1.9702 | 1.9726 |
| Pivot points | S3 | S2 | S1 | PP | R1 | R2 | R3 |
|---|---|---|---|---|---|---|---|
| Standard | 1.9202 | 1.9353 | 1.9509 | 1.9660 | 1.9816 | 1.9967 | 2.0123 |
| Camarilla | 1.9581 | 1.9609 | 1.9637 | 1.9665 | 1.9693 | 1.9721 | 1.9749 |
| Woodie | 1.9205 | 1.9354 | 1.9512 | 1.9661 | 1.9819 | 1.9968 | 2.0126 |
| Fibonacci | 1.9353 | 1.9470 | 1.9543 | 1.9660 | 1.9777 | 1.9850 | 1.9967 |
| Pivot points | S3 | S2 | S1 | PP | R1 | R2 | R3 |
|---|---|---|---|---|---|---|---|
| Standard | 1.8202 | 1.8561 | 1.9094 | 1.9453 | 1.9986 | 2.0345 | 2.0878 |
| Camarilla | 1.9383 | 1.9465 | 1.9546 | 1.9628 | 1.9710 | 1.9792 | 1.9873 |
| Woodie | 1.8290 | 1.8605 | 1.9182 | 1.9497 | 2.0074 | 2.0389 | 2.0966 |
| Fibonacci | 1.8561 | 1.8901 | 1.9112 | 1.9453 | 1.9793 | 2.0004 | 2.0345 |
Numerical data
The following is the status of technical indicators and moving averages registered at the time this technical analysis was created:
| RSI (14): | 64.94 | |
| MACD (12,26,9): | 0.0091 | |
| Directional Movement: | 20.5188 | |
| AROON (14): | 85.7142 | |
| DEMA (21): | 1.9380 | |
| Parabolic SAR (0,02-0,02-0,2): | 1.9001 | |
| Elder Ray (13): | 0.0316 | |
| Super Trend (3,10): | 1.8962 | |
| Zig ZAG (10): | 1.9676 | |
| VORTEX (21): | 1.0709 | |
| Stochastique (14,3,5): | 85.26 | |
| TEMA (21): | 1.9432 | |
| Williams %R (14): | -15.25 | |
| Chande Momentum Oscillator (20): | 0.0694 | |
| Repulse (5,40,3): | 1.7756 | |
| ROCnROLL: | 1 | |
| TRIX (15,9): | 0.0146 | |
| Courbe Coppock: | 2.38 |
| MA7: | 1.9645 | |
| MA20: | 1.9456 | |
| MA50: | 1.9247 | |
| MA100: | 1.9214 | |
| MAexp7: | 1.9446 | |
| MAexp20: | 1.9284 | |
| MAexp50: | 1.9137 | |
| MAexp100: | 1.8892 | |
| Price / MA7: | +0.19% | |
| Price / MA20: | +1.17% | |
| Price / MA50: | +2.27% | |
| Price / MA100: | +2.44% | |
| Price / MAexp7: | +1.22% | |
| Price / MAexp20: | +2.07% | |
| Price / MAexp50: | +2.85% | |
| Price / MAexp100: | +4.19% |
News
The last news published on GBP/AUD at the time of the generation of this analysis was as follows:
-
 GBPAUD Clears 1.8500 Level
-
Pound Pairs Breaking Critical Levels From GBP/USD to GBP/AUD (Quick Take Video)
-
Volatility In Commodities GBP/AUD
-
Risk on pressures GBPAUD
-
Potential short-term upside for GBP/USD, GBP/AUD a longer-term play on sterling weakness
About author

Online


Add a comment
Comments
0 comments on the analysis GBP/AUD - Weekly