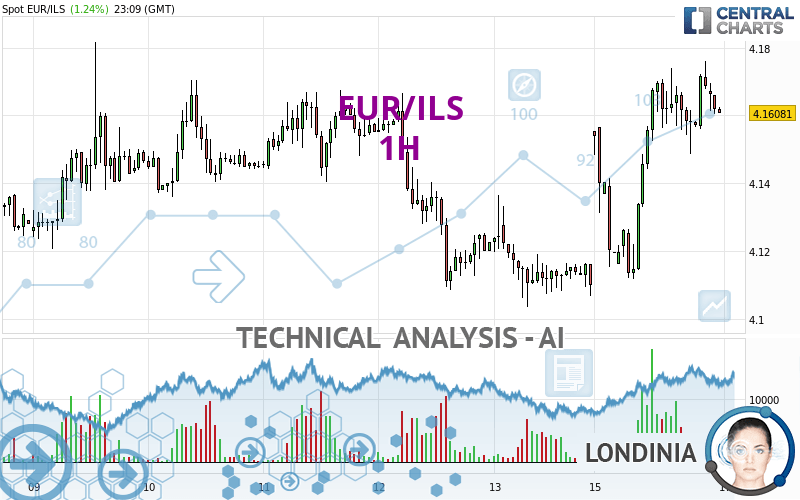
EUR/ILS - 1H - Technical analysis published on 09/16/2024 (GMT)
- 97
- 0
Click here for a new analysis!
- Timeframe : 1H
- - Analysis generated on
- Status : TARGET REACHED

Summary of the analysis

Additional analysis
Quotes
The EUR/ILS rating is 4.16081 ILS. The price has increased by +1.24% since the last closing and was between 4.11174 ILS and 4.17599 ILS. This implies that the price is at +1.19% from its lowest and at -0.36% from its highest.A study of price movements over other periods shows the following variations:
Near a new HIGH record (5 years)
Type : Bullish
Timeframe : Weekly
Near a new HIGH record (1 year)
Type : Bullish
Timeframe : Weekly
Near a new HIGH record (1st january)
Type : Bullish
Timeframe : Weekly
Near a new LOW record (1 month)
Type : Bearish
Timeframe : Weekly
Technical
Technical analysis of this 1H chart of EUR/ILS indicates that the overall trend is strongly bullish. The signals given by the moving averages are 89.29% bullish. This strong bullish trend is confirmed by the strong signals currently being given by short-term moving averages. The Central Indicators scanner does not detect any result on moving averages that would impact this trend.
The probability of a further increase is slight given the direction of the technical indicators.
Central Indicators, the detector scanner for these technical indicators has recently detected several signals:
Pivot points : price is over resistance 1
Type : Neutral
Timeframe : Weekly
Pivot points : price is over resistance 2
Type : Neutral
Timeframe : 1 hour
The Central Patterns scanner, which studies chart patterns, resistances and supports, has identified this signal:
Resistance of channel is broken
Type : Bullish
Timeframe : 1 hour
The Central Candlesticks scanner, specialised in Japanese candlesticks, did not identify any signals.
| S3 | S2 | S1 | Price | R1 | R2 | R3 | |
|---|---|---|---|---|---|---|---|
| ProTrendLines | 4.12029 | 4.13632 | 4.14955 | 4.16081 | 4.16710 | 4.18712 | 4.31706 |
| Change (%) | -0.97% | -0.59% | -0.27% | - | +0.15% | +0.63% | +3.76% |
| Change | -0.04052 | -0.02449 | -0.01126 | - | +0.00629 | +0.02631 | +0.15625 |
| Level | Minor | Intermediate | Minor | - | Intermediate | Major | Major |
To determine price objectives, it is also possible to use the pivot points. Here is the price position in relation to pivot points:
| Pivot points | S3 | S2 | S1 | PP | R1 | R2 | R3 |
|---|---|---|---|---|---|---|---|
| Standard | 4.06378 | 4.08361 | 4.09680 | 4.11663 | 4.12982 | 4.14965 | 4.16284 |
| Camarilla | 4.10090 | 4.10393 | 4.10695 | 4.10998 | 4.11301 | 4.11603 | 4.11906 |
| Woodie | 4.06045 | 4.08195 | 4.09347 | 4.11497 | 4.12649 | 4.14799 | 4.15951 |
| Fibonacci | 4.08361 | 4.09623 | 4.10402 | 4.11663 | 4.12925 | 4.13704 | 4.14965 |
| Pivot points | S3 | S2 | S1 | PP | R1 | R2 | R3 |
|---|---|---|---|---|---|---|---|
| Standard | 4.00354 | 4.05349 | 4.08174 | 4.13169 | 4.15994 | 4.20989 | 4.23814 |
| Camarilla | 4.08848 | 4.09564 | 4.10281 | 4.10998 | 4.11715 | 4.12432 | 4.13149 |
| Woodie | 3.99268 | 4.04807 | 4.07088 | 4.12627 | 4.14908 | 4.20447 | 4.22728 |
| Fibonacci | 4.05349 | 4.08337 | 4.10182 | 4.13169 | 4.16157 | 4.18002 | 4.20989 |
| Pivot points | S3 | S2 | S1 | PP | R1 | R2 | R3 |
|---|---|---|---|---|---|---|---|
| Standard | 3.73610 | 3.87427 | 3.94352 | 4.08169 | 4.15094 | 4.28911 | 4.35836 |
| Camarilla | 3.95573 | 3.97474 | 3.99376 | 4.01277 | 4.03178 | 4.05080 | 4.06981 |
| Woodie | 3.70164 | 3.85704 | 3.90906 | 4.06446 | 4.11648 | 4.27188 | 4.32390 |
| Fibonacci | 3.87427 | 3.95350 | 4.00246 | 4.08169 | 4.16092 | 4.20988 | 4.28911 |
Numerical data
The following is the status of the technical indicators and moving averages at the time of publication of this technical analysis:
| RSI (14): | 57.97 | |
| MACD (12,26,9): | 0.0090 | |
| Directional Movement: | 9.65818 | |
| AROON (14): | 21.42857 | |
| DEMA (21): | 4.16780 | |
| Parabolic SAR (0,02-0,02-0,2): | 4.15904 | |
| Elder Ray (13): | 0.00178 | |
| Super Trend (3,10): | 4.13864 | |
| Zig ZAG (10): | 4.16155 | |
| VORTEX (21): | 1.1968 | |
| Stochastique (14,3,5): | 54.81 | |
| TEMA (21): | 4.17105 | |
| Williams %R (14): | -52.64 | |
| Chande Momentum Oscillator (20): | -0.00046 | |
| Repulse (5,40,3): | -0.0266 | |
| ROCnROLL: | 1 | |
| TRIX (15,9): | 0.0363 | |
| Courbe Coppock: | 0.80 |
| MA7: | 4.13817 | |
| MA20: | 4.10775 | |
| MA50: | 4.06536 | |
| MA100: | 4.03643 | |
| MAexp7: | 4.16297 | |
| MAexp20: | 4.15554 | |
| MAexp50: | 4.14374 | |
| MAexp100: | 4.13782 | |
| Price / MA7: | +0.55% | |
| Price / MA20: | +1.29% | |
| Price / MA50: | +2.35% | |
| Price / MA100: | +3.08% | |
| Price / MAexp7: | -0.05% | |
| Price / MAexp20: | +0.13% | |
| Price / MAexp50: | +0.41% | |
| Price / MAexp100: | +0.56% |
About author
Online


Add a comment
Comments
0 comments on the analysis EUR/ILS - 1H