| Open: | - |
| Change: | - |
| Volume: | - |
| Low: | - |
| High: | - |
| High / Low range: | - |
| Type: | Forex |
| Ticker: | EURILS |
| ISIN: |
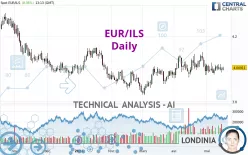
EUR/ILS - Daily - Technical analysis published on 05/16/2024 (GMT)
- 141
- 0
- 05/16/2024 - 13:13
Click here for a new analysis!
- Timeframe : Daily
- - Analysis generated on 05/16/2024 - 13:13
- Status : LEVEL MAINTAINED

Summary of the analysis

Additional analysis
Quotes
The EUR/ILS rating is 4.00911 ILS. The price registered an increase of +0.35% on the session and was between 3.98956 ILS and 4.01481 ILS. This implies that the price is at +0.49% from its lowest and at -0.14% from its highest.Here is a more detailed summary of the historical variations registered by EUR/ILS:
Near a new LOW record (1 year)
Type : Bearish
Timeframe : Weekly
Near a new LOW record (1st january)
Type : Bearish
Timeframe : Weekly
Near a new HIGH record (1 month)
Type : Bullish
Timeframe : Weekly
Technical
Technical analysis of EUR/ILS in Daily shows an overall bullish trend. 67.86% of the signals given by moving averages are bullish. The overall trend seems to be showing some signs of weakness, as do the tentative bullish signals given by short-term moving averages. An assessment of moving averages reveals several bearish and bullish signals:
Bearish trend reversal : Moving Average 20
Type : Bearish
Timeframe : Daily
Bearish trend reversal : Moving Average 100
Type : Bearish
Timeframe : Daily
Bullish price crossover with Moving Average 50
Type : Bullish
Timeframe : Daily
Bullish price crossover with adaptative moving average 50
Type : Bullish
Timeframe : Daily
The probability of a further increase is slight given the direction of the technical indicators.
Central Indicators, the scanner specialised in technical indicators, has identified these signals:
RSI indicator is back over 50
Type : Bullish
Timeframe : Daily
Ichimoku : price is over the cloud
Type : Bullish
Timeframe : Daily
Price is back over the pivot point
Type : Bullish
Timeframe : Weekly
Momentum indicator is back over 0
Type : Bullish
Timeframe : Daily
The Central Patterns scanner, which studies chart patterns, resistances and supports, has identified these signals:
Near horizontal resistance
Type : Bearish
Timeframe : Daily
Near support of triangle
Type : Bullish
Timeframe : Daily
The Central Candlesticks scanner which studies Japanese candlesticks did not detect anything.
| S3 | S2 | S1 | Price | R1 | R2 | R3 | |
|---|---|---|---|---|---|---|---|
| ProTrendLines | 3.85450 | 3.92602 | 4.00827 | 4.00911 | 4.07922 | 4.12783 | 4.21065 |
| Change (%) | -3.86% | -2.07% | -0.02% | - | +1.75% | +2.96% | +5.03% |
| Change | -0.15461 | -0.08309 | -0.00084 | - | +0.07011 | +0.11872 | +0.20154 |
| Level | Major | Minor | Major | - | Intermediate | Intermediate | Intermediate |
To determine price objectives, it is also possible to use the pivot points. Here is the price position in relation to pivot points:
| Pivot points | S3 | S2 | S1 | PP | R1 | R2 | R3 |
|---|---|---|---|---|---|---|---|
| Standard | 3.94581 | 3.96191 | 3.97852 | 3.99462 | 4.01123 | 4.02733 | 4.04394 |
| Camarilla | 3.98614 | 3.98913 | 3.99213 | 3.99513 | 3.99813 | 4.00113 | 4.00413 |
| Woodie | 3.94607 | 3.96204 | 3.97878 | 3.99475 | 4.01149 | 4.02746 | 4.04420 |
| Fibonacci | 3.96191 | 3.97441 | 3.98213 | 3.99462 | 4.00712 | 4.01484 | 4.02733 |
| Pivot points | S3 | S2 | S1 | PP | R1 | R2 | R3 |
|---|---|---|---|---|---|---|---|
| Standard | 3.89089 | 3.92785 | 3.96550 | 4.00246 | 4.04011 | 4.07707 | 4.11472 |
| Camarilla | 3.98262 | 3.98946 | 3.99630 | 4.00314 | 4.00998 | 4.01682 | 4.02366 |
| Woodie | 3.89123 | 3.92802 | 3.96584 | 4.00263 | 4.04045 | 4.07724 | 4.11506 |
| Fibonacci | 3.92785 | 3.95635 | 3.97396 | 4.00246 | 4.03096 | 4.04857 | 4.07707 |
| Pivot points | S3 | S2 | S1 | PP | R1 | R2 | R3 |
|---|---|---|---|---|---|---|---|
| Standard | 3.75658 | 3.84973 | 3.91826 | 4.01141 | 4.07994 | 4.17309 | 4.24162 |
| Camarilla | 3.94233 | 3.95715 | 3.97197 | 3.98679 | 4.00161 | 4.01643 | 4.03125 |
| Woodie | 3.74427 | 3.84358 | 3.90595 | 4.00526 | 4.06763 | 4.16694 | 4.22931 |
| Fibonacci | 3.84973 | 3.91149 | 3.94965 | 4.01141 | 4.07317 | 4.11133 | 4.17309 |
Numerical data
The following are the details of the technical indicators and moving averages that were collected to generate this technical analysis:
| RSI (14): | 51.00 | |
| MACD (12,26,9): | -0.0008 | |
| Directional Movement: | 0.50535 | |
| AROON (14): | -14.28571 | |
| DEMA (21): | 4.00705 | |
| Parabolic SAR (0,02-0,02-0,2): | 4.07396 | |
| Elder Ray (13): | -0.00275 | |
| Super Trend (3,10): | 3.93113 | |
| Zig ZAG (10): | 4.01004 | |
| VORTEX (21): | 1.0031 | |
| Stochastique (14,3,5): | 30.54 | |
| TEMA (21): | 3.99888 | |
| Williams %R (14): | -56.25 | |
| Chande Momentum Oscillator (20): | 0.02325 | |
| Repulse (5,40,3): | 0.2218 | |
| ROCnROLL: | 1 | |
| TRIX (15,9): | 0.0052 | |
| Courbe Coppock: | 1.75 |
| MA7: | 4.00317 | |
| MA20: | 4.01274 | |
| MA50: | 3.99944 | |
| MA100: | 3.99102 | |
| MAexp7: | 4.00278 | |
| MAexp20: | 4.00603 | |
| MAexp50: | 4.00009 | |
| MAexp100: | 4.00350 | |
| Price / MA7: | +0.15% | |
| Price / MA20: | -0.09% | |
| Price / MA50: | +0.24% | |
| Price / MA100: | +0.45% | |
| Price / MAexp7: | +0.16% | |
| Price / MAexp20: | +0.08% | |
| Price / MAexp50: | +0.23% | |
| Price / MAexp100: | +0.14% |
About author

Online


Add a comment
Comments
0 comments on the analysis EUR/ILS - Daily