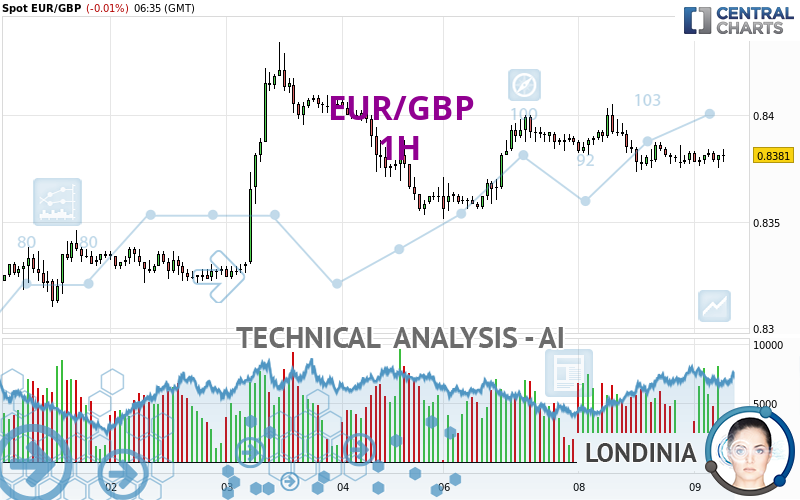
EUR/GBP - 1H - Technical analysis published on 10/09/2024 (GMT)
- 80
- 0
- Timeframe : 1H
- - Analysis generated on
- Status : NEUTRAL
Summary of the analysis

Additional analysis
Quotes
EUR/GBP rating 0.8381 GBP. The price is lower by -0.01% since the last closing and was between 0.8375 GBP and 0.8384 GBP. This implies that the price is at +0.07% from its lowest and at -0.04% from its highest.Here is a more detailed summary of the historical variations registered by EUR/GBP:
Near a new LOW record (5 years)
Type : Bearish
Timeframe : Weekly
Near a new HIGH record (1 year)
Type : Bullish
Timeframe : Weekly
Near a new HIGH record (1st january)
Type : Bullish
Timeframe : Weekly
Near a new HIGH record (1 month)
Type : Bullish
Timeframe : Weekly
Technical
Technical analysis of EUR/GBP in 1H shows a neutral overall trend. This generally neutral trend is confirmed by the neutral signals currently given by short-term moving averages. The Central Indicators market scanner is currently detecting several bearish and bullish signals that could impact this trend:
Bearish price crossover with Moving Average 20
Type : Bearish
Timeframe : 1 hour
Bullish price crossover with adaptative moving average 50
Type : Bullish
Timeframe : 1 hour
In fact, Central Analyzer took into account 18 technical indicators and the result was as follows: 5 are bullish, 4 are neutral and 9 are bearish. Central Indicators, the scanner specialised in technical indicators, has identified these signals:
RSI indicator is back over 50
Type : Bullish
Timeframe : 1 hour
Aroon indicator bearish trend
Type : Bearish
Timeframe : 1 hour
Ichimoku : price is over the cloud
Type : Bullish
Timeframe : 1 hour
Price is back over the pivot point
Type : Bullish
Timeframe : Weekly
Momentum indicator is back over 0
Type : Bullish
Timeframe : 1 hour
The Central Patterns scanner, which studies chart patterns, resistances and supports, has identified this signal:
Near support of triangle
Type : Bullish
Timeframe : 1 hour
There is also a Japanese candlestick pattern detected by Central Candlesticks that could mark the end of the current short-term trend:
Doji
Type : Neutral
Timeframe : 1 hour
| S3 | S2 | S1 | Price | R1 | R2 | R3 | |
|---|---|---|---|---|---|---|---|
| ProTrendLines | 0.8335 | 0.8351 | 0.8373 | 0.8381 | 0.8396 | 0.8434 | 0.8446 |
| Change (%) | -0.55% | -0.36% | -0.10% | - | +0.18% | +0.63% | +0.78% |
| Change | -0.0046 | -0.0030 | -0.0008 | - | +0.0015 | +0.0053 | +0.0065 |
| Level | Minor | Intermediate | Minor | - | Major | Intermediate | Intermediate |
Attention could also be paid to pivot points to set price objectives:
| Pivot points | S3 | S2 | S1 | PP | R1 | R2 | R3 |
|---|---|---|---|---|---|---|---|
| Standard | 0.8336 | 0.8355 | 0.8368 | 0.8387 | 0.8400 | 0.8419 | 0.8432 |
| Camarilla | 0.8373 | 0.8376 | 0.8379 | 0.8382 | 0.8385 | 0.8388 | 0.8391 |
| Woodie | 0.8334 | 0.8354 | 0.8366 | 0.8386 | 0.8398 | 0.8418 | 0.8430 |
| Fibonacci | 0.8355 | 0.8367 | 0.8374 | 0.8387 | 0.8399 | 0.8406 | 0.8419 |
| Pivot points | S3 | S2 | S1 | PP | R1 | R2 | R3 |
|---|---|---|---|---|---|---|---|
| Standard | 0.8179 | 0.8245 | 0.8303 | 0.8369 | 0.8427 | 0.8493 | 0.8551 |
| Camarilla | 0.8328 | 0.8339 | 0.8351 | 0.8362 | 0.8373 | 0.8385 | 0.8396 |
| Woodie | 0.8176 | 0.8243 | 0.8300 | 0.8367 | 0.8424 | 0.8491 | 0.8548 |
| Fibonacci | 0.8245 | 0.8292 | 0.8321 | 0.8369 | 0.8416 | 0.8445 | 0.8493 |
| Pivot points | S3 | S2 | S1 | PP | R1 | R2 | R3 |
|---|---|---|---|---|---|---|---|
| Standard | 0.8118 | 0.8215 | 0.8270 | 0.8367 | 0.8422 | 0.8519 | 0.8574 |
| Camarilla | 0.8283 | 0.8297 | 0.8311 | 0.8325 | 0.8339 | 0.8353 | 0.8367 |
| Woodie | 0.8097 | 0.8205 | 0.8249 | 0.8357 | 0.8401 | 0.8509 | 0.8553 |
| Fibonacci | 0.8215 | 0.8273 | 0.8309 | 0.8367 | 0.8425 | 0.8461 | 0.8519 |
Numerical data
The following is the status of technical indicators and moving averages registered at the time this technical analysis was created:
| RSI (14): | 42.84 | |
| MACD (12,26,9): | -0.0002 | |
| Directional Movement: | -1.7389 | |
| AROON (14): | 7.1429 | |
| DEMA (21): | 0.8380 | |
| Parabolic SAR (0,02-0,02-0,2): | 0.8389 | |
| Elder Ray (13): | -0.0002 | |
| Super Trend (3,10): | 0.8375 | |
| Zig ZAG (10): | 0.8378 | |
| VORTEX (21): | 0.8855 | |
| Stochastique (14,3,5): | 41.67 | |
| TEMA (21): | 0.8378 | |
| Williams %R (14): | -75.00 | |
| Chande Momentum Oscillator (20): | -0.0006 | |
| Repulse (5,40,3): | -0.0231 | |
| ROCnROLL: | 2 | |
| TRIX (15,9): | -0.0025 | |
| Courbe Coppock: | 0.05 |
| MA7: | 0.8368 | |
| MA20: | 0.8377 | |
| MA50: | 0.8447 | |
| MA100: | 0.8452 | |
| MAexp7: | 0.8380 | |
| MAexp20: | 0.8381 | |
| MAexp50: | 0.8381 | |
| MAexp100: | 0.8376 | |
| Price / MA7: | +0.16% | |
| Price / MA20: | +0.05% | |
| Price / MA50: | -0.78% | |
| Price / MA100: | -0.84% | |
| Price / MAexp7: | +0.01% | |
| Price / MAexp20: | -0% | |
| Price / MAexp50: | -0% | |
| Price / MAexp100: | +0.06% |
News
Don't forget to follow the news on EUR/GBP. At the time of publication of this analysis, the latest news was as follows:
-
 EUR/GBP Forecast August 20, 2024
-
Technical Analysis on USDJPY, GBPUSD, EURGBP
-
EUR/GBP Forecast July 4, 2024
-
Weekly Technical Outlook: 01/07/2024 - EURGBP, USDJPY, USDCAD
-
EUR/GBP Forecast June 28, 2024
About author
Online


Add a comment
Comments
0 comments on the analysis EUR/GBP - 1H