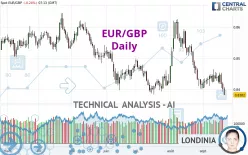
EUR/GBP - Daily - Technical analysis published on 09/20/2024 (GMT)
- 152
- 0
Click here for a new analysis!
- Timeframe : Daily
- - Analysis generated on
- Status : TARGET REACHED

Summary of the analysis

Additional analysis
Quotes
The EUR/GBP price is 0.8382 GBP. On the day, this instrument lost -0.24% and was between 0.8381 GBP and 0.8407 GBP. This implies that the price is at +0.01% from its lowest and at -0.30% from its highest.So that you have an overall view of the price change, here is a table showing the variations over several periods:
Near a new LOW record (5 years)
Type : Bearish
Timeframe : Weekly
Near a new HIGH record (1 year)
Type : Bullish
Timeframe : Weekly
Near a new HIGH record (1st january)
Type : Bullish
Timeframe : Weekly
Near a new HIGH record (1 month)
Type : Bullish
Timeframe : Weekly
New LOW record (1 month)
Type : Bearish
Timeframe : Weekly
Technical
Technical analysis of this Daily chart of EUR/GBP indicates that the overall trend is strongly bearish. 92.86% of the signals given by moving averages are bearish. This strongly bearish trend is supported by the strong bearish signals given by short-term moving averages. The Central Indicators scanner does not detect any result on moving averages that would impact this trend.
An assessment of technical indicators shows a bearish signal.
Other results related to technical indicators were also found by the Central Indicators scanner:
Pivot points : price is under support 1
Type : Neutral
Timeframe : Daily
Pivot points : price is under support 3
Type : Neutral
Timeframe : Weekly
An analysis of the price chart with the Central Patterns scanner (detector of chart patterns and resistances and supports) shows a result that can have an impact on the price change:
Near support of channel
Type : Bullish
Timeframe : Daily
No result was found by the Central Candlesticks scanner on Japanese candlesticks.
| S3 | S2 | S1 | Price | R1 | R2 | R3 | |
|---|---|---|---|---|---|---|---|
| ProTrendLines | 0.6942 | 0.7777 | 0.8300 | 0.8382 | 0.8396 | 0.8512 | 0.8580 |
| Change (%) | -17.18% | -7.22% | -0.98% | - | +0.17% | +1.55% | +2.36% |
| Change | -0.1440 | -0.0605 | -0.0082 | - | +0.0014 | +0.0130 | +0.0198 |
| Level | Minor | Intermediate | Major | - | Major | Major | Minor |
To determine price objectives, it is also possible to use the pivot points. Here is the price position in relation to pivot points:
| Pivot points | S3 | S2 | S1 | PP | R1 | R2 | R3 |
|---|---|---|---|---|---|---|---|
| Standard | 0.8357 | 0.8375 | 0.8388 | 0.8406 | 0.8419 | 0.8437 | 0.8450 |
| Camarilla | 0.8394 | 0.8396 | 0.8399 | 0.8402 | 0.8405 | 0.8408 | 0.8411 |
| Woodie | 0.8356 | 0.8374 | 0.8387 | 0.8405 | 0.8418 | 0.8436 | 0.8449 |
| Fibonacci | 0.8375 | 0.8387 | 0.8394 | 0.8406 | 0.8418 | 0.8425 | 0.8437 |
| Pivot points | S3 | S2 | S1 | PP | R1 | R2 | R3 |
|---|---|---|---|---|---|---|---|
| Standard | 0.8377 | 0.8400 | 0.8419 | 0.8442 | 0.8461 | 0.8484 | 0.8503 |
| Camarilla | 0.8428 | 0.8431 | 0.8435 | 0.8439 | 0.8443 | 0.8447 | 0.8451 |
| Woodie | 0.8376 | 0.8399 | 0.8418 | 0.8441 | 0.8460 | 0.8483 | 0.8502 |
| Fibonacci | 0.8400 | 0.8416 | 0.8426 | 0.8442 | 0.8458 | 0.8468 | 0.8484 |
| Pivot points | S3 | S2 | S1 | PP | R1 | R2 | R3 |
|---|---|---|---|---|---|---|---|
| Standard | 0.8109 | 0.8255 | 0.8334 | 0.8480 | 0.8559 | 0.8705 | 0.8784 |
| Camarilla | 0.8352 | 0.8373 | 0.8393 | 0.8414 | 0.8435 | 0.8455 | 0.8476 |
| Woodie | 0.8077 | 0.8238 | 0.8302 | 0.8463 | 0.8527 | 0.8688 | 0.8752 |
| Fibonacci | 0.8255 | 0.8341 | 0.8394 | 0.8480 | 0.8566 | 0.8619 | 0.8705 |
Numerical data
The following are the details of the technical indicators and moving averages that were collected to generate this technical analysis:
| RSI (14): | 35.06 | |
| MACD (12,26,9): | -0.0019 | |
| Directional Movement: | -9.4871 | |
| AROON (14): | -50.0000 | |
| DEMA (21): | 0.8413 | |
| Parabolic SAR (0,02-0,02-0,2): | 0.8460 | |
| Elder Ray (13): | -0.0031 | |
| Super Trend (3,10): | 0.8488 | |
| Zig ZAG (10): | 0.8385 | |
| VORTEX (21): | 0.8479 | |
| Stochastique (14,3,5): | 13.90 | |
| TEMA (21): | 0.8401 | |
| Williams %R (14): | -98.77 | |
| Chande Momentum Oscillator (20): | -0.0045 | |
| Repulse (5,40,3): | -0.5770 | |
| ROCnROLL: | 2 | |
| TRIX (15,9): | -0.0288 | |
| Courbe Coppock: | 0.34 |
| MA7: | 0.8421 | |
| MA20: | 0.8429 | |
| MA50: | 0.8464 | |
| MA100: | 0.8481 | |
| MAexp7: | 0.8414 | |
| MAexp20: | 0.8436 | |
| MAexp50: | 0.8459 | |
| MAexp100: | 0.8483 | |
| Price / MA7: | -0.46% | |
| Price / MA20: | -0.56% | |
| Price / MA50: | -0.97% | |
| Price / MA100: | -1.17% | |
| Price / MAexp7: | -0.38% | |
| Price / MAexp20: | -0.64% | |
| Price / MAexp50: | -0.91% | |
| Price / MAexp100: | -1.19% |
News
The last news published on EUR/GBP at the time of the generation of this analysis was as follows:
-
 EUR/GBP Forecast August 20, 2024
-
Technical Analysis on USDJPY, GBPUSD, EURGBP
-
EUR/GBP Forecast July 4, 2024
-
Weekly Technical Outlook: 01/07/2024 - EURGBP, USDJPY, USDCAD
-
EUR/GBP Forecast June 28, 2024
About author

Online


Add a comment
Comments
0 comments on the analysis EUR/GBP - Daily