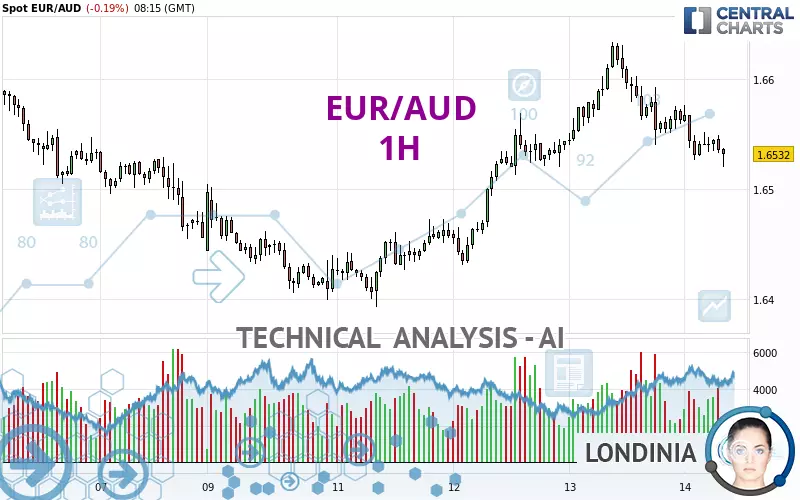
EUR/AUD - 1H - Technical analysis published on 02/14/2025 (GMT)
- 83
- 0
- Timeframe : 1H
- - Analysis generated on
- Status : IN PROGRESS...

Summary of the analysis

Additional analysis
Quotes
The EUR/AUD rating is 1.6532 AUD. The price is lower by -0.19% since the last closing and was between 1.6520 AUD and 1.6577 AUD. This implies that the price is at +0.07% from its lowest and at -0.27% from its highest.The Central Gaps scanner detects a bearish opening marking the presence of sellers ahead of buyers at the opening but not sufficiently marked to allow the price to register a quotation gap.
Bearish opening
Type : Bearish
Timeframe : Openning
A study of price movements over other periods shows the following variations:
Near a new HIGH record (1 year)
Type : Bullish
Timeframe : Weekly
Near a new HIGH record (1st january)
Type : Bullish
Timeframe : Weekly
Near a new HIGH record (1 month)
Type : Bullish
Timeframe : Weekly
Technical
A technical analysis in 1H of this EUR/AUD chart shows a slightly bullish trend. 57.14% of the signals given by moving averages are bullish. Caution: the strong bearish signals currently given by short-term moving averages indicate that a trend reversal may be taking place. There is no crossing of moving average by the price or crossing of moving averages between themselves.
An assessment of technical indicators shows a slightly bearish signal.
Caution: the Central Indicators scanner currently detects an excess:
Williams %R indicator is oversold : under -80
Type : Neutral
Timeframe : 1 hour
An analysis of the price chart with the Central Patterns scanner (detector of chart patterns and resistances and supports) shows several results that can have an impact on the price change:
Near horizontal support
Type : Bullish
Timeframe : 1 hour
Support of channel is broken
Type : Bearish
Timeframe : 1 hour
The Central Candlesticks scanner which studies Japanese candlesticks did not detect anything.
| S3 | S2 | S1 | Price | R1 | R2 | R3 | |
|---|---|---|---|---|---|---|---|
| ProTrendLines | 1.6410 | 1.6432 | 1.6496 | 1.6532 | 1.6552 | 1.6596 | 1.6619 |
| Change (%) | -0.74% | -0.60% | -0.22% | - | +0.12% | +0.39% | +0.53% |
| Change | -0.0122 | -0.0100 | -0.0036 | - | +0.0020 | +0.0064 | +0.0087 |
| Level | Intermediate | Minor | Minor | - | Major | Minor | Intermediate |
To determine price objectives, it is also possible to use the pivot points. Here is the price position in relation to pivot points:
| Pivot points | S3 | S2 | S1 | PP | R1 | R2 | R3 |
|---|---|---|---|---|---|---|---|
| Standard | 1.6430 | 1.6485 | 1.6524 | 1.6579 | 1.6618 | 1.6673 | 1.6712 |
| Camarilla | 1.6537 | 1.6546 | 1.6554 | 1.6563 | 1.6572 | 1.6580 | 1.6589 |
| Woodie | 1.6422 | 1.6481 | 1.6516 | 1.6575 | 1.6610 | 1.6669 | 1.6704 |
| Fibonacci | 1.6485 | 1.6521 | 1.6543 | 1.6579 | 1.6615 | 1.6637 | 1.6673 |
| Pivot points | S3 | S2 | S1 | PP | R1 | R2 | R3 |
|---|---|---|---|---|---|---|---|
| Standard | 1.6008 | 1.6231 | 1.6344 | 1.6567 | 1.6680 | 1.6903 | 1.7016 |
| Camarilla | 1.6364 | 1.6394 | 1.6425 | 1.6456 | 1.6487 | 1.6518 | 1.6548 |
| Woodie | 1.5952 | 1.6204 | 1.6288 | 1.6540 | 1.6624 | 1.6876 | 1.6960 |
| Fibonacci | 1.6231 | 1.6360 | 1.6439 | 1.6567 | 1.6696 | 1.6775 | 1.6903 |
| Pivot points | S3 | S2 | S1 | PP | R1 | R2 | R3 |
|---|---|---|---|---|---|---|---|
| Standard | 1.6218 | 1.6351 | 1.6514 | 1.6647 | 1.6810 | 1.6943 | 1.7106 |
| Camarilla | 1.6595 | 1.6622 | 1.6649 | 1.6676 | 1.6703 | 1.6730 | 1.6757 |
| Woodie | 1.6232 | 1.6359 | 1.6528 | 1.6655 | 1.6824 | 1.6951 | 1.7120 |
| Fibonacci | 1.6351 | 1.6464 | 1.6534 | 1.6647 | 1.6760 | 1.6830 | 1.6943 |
Numerical data
The following is the status of the technical indicators and moving averages at the time of publication of this technical analysis:
| RSI (14): | 43.84 | |
| MACD (12,26,9): | -0.0005 | |
| Directional Movement: | -5.9820 | |
| AROON (14): | -57.1428 | |
| DEMA (21): | 1.6552 | |
| Parabolic SAR (0,02-0,02-0,2): | 1.6554 | |
| Elder Ray (13): | -0.0007 | |
| Super Trend (3,10): | 1.6595 | |
| Zig ZAG (10): | 1.6543 | |
| VORTEX (21): | 0.8200 | |
| Stochastique (14,3,5): | 24.24 | |
| TEMA (21): | 1.6536 | |
| Williams %R (14): | -72.73 | |
| Chande Momentum Oscillator (20): | -0.0016 | |
| Repulse (5,40,3): | 0.0131 | |
| ROCnROLL: | -1 | |
| TRIX (15,9): | -0.0011 | |
| Courbe Coppock: | 0.41 |
| MA7: | 1.6504 | |
| MA20: | 1.6588 | |
| MA50: | 1.6592 | |
| MA100: | 1.6425 | |
| MAexp7: | 1.6546 | |
| MAexp20: | 1.6555 | |
| MAexp50: | 1.6545 | |
| MAexp100: | 1.6530 | |
| Price / MA7: | +0.17% | |
| Price / MA20: | -0.34% | |
| Price / MA50: | -0.36% | |
| Price / MA100: | +0.65% | |
| Price / MAexp7: | -0.08% | |
| Price / MAexp20: | -0.14% | |
| Price / MAexp50: | -0.08% | |
| Price / MAexp100: | +0.01% |
News
The latest news and videos published on EUR/AUD at the time of the analysis were as follows:
-
 EUR/AUD Forecast December 5, 2024
-
EUR/AUD Forecast November 14, 2024
-
EUR/AUD Forecast September 25, 2024
-
Both Dollar and S&P 500 Edge Higher after Factory Report, EURAUD A Pair to Watch
-
Weekly Technical Analysis: 19/08/2019 - GBPJPY, USDCAD, EURAUD
About author

Online


Add a comment
Comments
0 comments on the analysis EUR/AUD - 1H