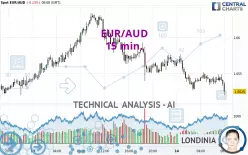
EUR/AUD - 15 min. - Technical analysis published on 02/14/2025 (GMT)
- 183
- 0
Click here for a new analysis!
- Timeframe : 15 min.
- - Analysis generated on
- Status : LEVEL MAINTAINED

Summary of the analysis

Additional analysis
Quotes
The EUR/AUD price is 1.6525 AUD. On the day, this instrument lost -0.23% with the lowest point at 1.6520 AUD and the highest point at 1.6577 AUD. The deviation from the price is +0.03% for the low point and -0.31% for the high point.The Central Gaps scanner detects a bearish opening. A small advantage for sellers in the very short term.
Bearish opening
Type : Bearish
Timeframe : Openning
A study of price movements over other periods shows the following variations:
Near a new HIGH record (1 year)
Type : Bullish
Timeframe : Weekly
Near a new HIGH record (1st january)
Type : Bullish
Timeframe : Weekly
Near a new HIGH record (1 month)
Type : Bullish
Timeframe : Weekly
Technical
A technical analysis in 15 min. of this EUR/AUD chart shows a sharp bearish trend. 89.29% of the signals given by moving averages are bearish. This strongly bearish trend is showing signs of slowing down given the slightly bearish signals given by short-term moving averages. The Central Indicators market scanner is currently detecting a bearish signal that could impact this trend:
Bearish price crossover with Moving Average 20
Type : Bearish
Timeframe : 15 minutes
On the 18 technical indicators analysed, 4 are bullish, 7 are neutral and 7 are bearish. Caution: the Central Indicators scanner currently detects an excess:
CCI indicator is oversold : under -100
Type : Neutral
Timeframe : 15 minutes
Williams %R indicator is back under -50
Type : Bearish
Timeframe : 15 minutes
Central Patterns, the market scanner focusing on chart patterns, resistances and supports found these results:
Near support of channel
Type : Bullish
Timeframe : 15 minutes
Near support of triangle
Type : Bullish
Timeframe : 15 minutes
Central Candlesticks, the scanner specialised in Japanese candlesticks, detects a bearish signal that could support the hypothesis of a small drop in the very short term:
Bearish engulfing lines
Type : Bearish
Timeframe : 15 minutes
| S3 | S2 | S1 | Price | R1 | R2 | R3 | |
|---|---|---|---|---|---|---|---|
| ProTrendLines | 1.6410 | 1.6432 | 1.6496 | 1.6525 | 1.6552 | 1.6596 | 1.6619 |
| Change (%) | -0.70% | -0.56% | -0.18% | - | +0.16% | +0.43% | +0.57% |
| Change | -0.0115 | -0.0093 | -0.0029 | - | +0.0027 | +0.0071 | +0.0094 |
| Level | Intermediate | Minor | Minor | - | Major | Minor | Intermediate |
Pivot points can also be used to set your price objectives. Here is the price situation in relation to pivot points:
| Pivot points | S3 | S2 | S1 | PP | R1 | R2 | R3 |
|---|---|---|---|---|---|---|---|
| Standard | 1.6430 | 1.6485 | 1.6524 | 1.6579 | 1.6618 | 1.6673 | 1.6712 |
| Camarilla | 1.6537 | 1.6546 | 1.6554 | 1.6563 | 1.6572 | 1.6580 | 1.6589 |
| Woodie | 1.6422 | 1.6481 | 1.6516 | 1.6575 | 1.6610 | 1.6669 | 1.6704 |
| Fibonacci | 1.6485 | 1.6521 | 1.6543 | 1.6579 | 1.6615 | 1.6637 | 1.6673 |
| Pivot points | S3 | S2 | S1 | PP | R1 | R2 | R3 |
|---|---|---|---|---|---|---|---|
| Standard | 1.6008 | 1.6231 | 1.6344 | 1.6567 | 1.6680 | 1.6903 | 1.7016 |
| Camarilla | 1.6364 | 1.6394 | 1.6425 | 1.6456 | 1.6487 | 1.6518 | 1.6548 |
| Woodie | 1.5952 | 1.6204 | 1.6288 | 1.6540 | 1.6624 | 1.6876 | 1.6960 |
| Fibonacci | 1.6231 | 1.6360 | 1.6439 | 1.6567 | 1.6696 | 1.6775 | 1.6903 |
| Pivot points | S3 | S2 | S1 | PP | R1 | R2 | R3 |
|---|---|---|---|---|---|---|---|
| Standard | 1.6218 | 1.6351 | 1.6514 | 1.6647 | 1.6810 | 1.6943 | 1.7106 |
| Camarilla | 1.6595 | 1.6622 | 1.6649 | 1.6676 | 1.6703 | 1.6730 | 1.6757 |
| Woodie | 1.6232 | 1.6359 | 1.6528 | 1.6655 | 1.6824 | 1.6951 | 1.7120 |
| Fibonacci | 1.6351 | 1.6464 | 1.6534 | 1.6647 | 1.6760 | 1.6830 | 1.6943 |
Numerical data
The following is the status of technical indicators and moving averages registered at the time this technical analysis was created:
| RSI (14): | 43.60 | |
| MACD (12,26,9): | -0.0003 | |
| Directional Movement: | -4.4871 | |
| AROON (14): | -21.4286 | |
| DEMA (21): | 1.6539 | |
| Parabolic SAR (0,02-0,02-0,2): | 1.6537 | |
| Elder Ray (13): | -0.0001 | |
| Super Trend (3,10): | 1.6559 | |
| Zig ZAG (10): | 1.6540 | |
| VORTEX (21): | 1.0187 | |
| Stochastique (14,3,5): | 46.30 | |
| TEMA (21): | 1.6541 | |
| Williams %R (14): | -61.11 | |
| Chande Momentum Oscillator (20): | -0.0006 | |
| Repulse (5,40,3): | -0.0315 | |
| ROCnROLL: | 2 | |
| TRIX (15,9): | -0.0035 | |
| Courbe Coppock: | 0.01 |
| MA7: | 1.6504 | |
| MA20: | 1.6588 | |
| MA50: | 1.6592 | |
| MA100: | 1.6425 | |
| MAexp7: | 1.6541 | |
| MAexp20: | 1.6544 | |
| MAexp50: | 1.6552 | |
| MAexp100: | 1.6556 | |
| Price / MA7: | +0.13% | |
| Price / MA20: | -0.38% | |
| Price / MA50: | -0.40% | |
| Price / MA100: | +0.61% | |
| Price / MAexp7: | -0.10% | |
| Price / MAexp20: | -0.11% | |
| Price / MAexp50: | -0.16% | |
| Price / MAexp100: | -0.19% |
News
The latest news and videos published on EUR/AUD at the time of the analysis were as follows:
-
 EUR/AUD Forecast December 5, 2024
-
EUR/AUD Forecast November 14, 2024
-
EUR/AUD Forecast September 25, 2024
-
Both Dollar and S&P 500 Edge Higher after Factory Report, EURAUD A Pair to Watch
-
Weekly Technical Analysis: 19/08/2019 - GBPJPY, USDCAD, EURAUD
About author

Online


Add a comment
Comments
0 comments on the analysis EUR/AUD - 15 min.