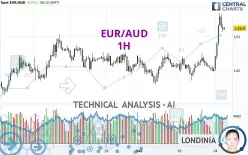
EUR/AUD - 1H - Technical analysis published on 12/04/2024 (GMT)
- 136
- 0
Click here for a new analysis!
- Timeframe : 1H
- - Analysis generated on
- Status : LEVEL MAINTAINED

Summary of the analysis

Additional analysis
Quotes
The EUR/AUD price is 1.6323 AUD. The price registered an increase of +0.72% on the session and was between 1.6199 AUD and 1.6369 AUD. This implies that the price is at +0.77% from its lowest and at -0.28% from its highest.So that you have an overall view of the price change, here is a table showing the variations over several periods:
Near a new HIGH record (1 year)
Type : Bullish
Timeframe : Weekly
Near a new HIGH record (1st january)
Type : Bullish
Timeframe : Weekly
Near a new LOW record (1 month)
Type : Bearish
Timeframe : Weekly
Technical
Technical analysis of EUR/AUD in 1H shows a strongly overall bullish trend. The signals given by the moving averages are 89.29% bullish. This strong bullish trend is confirmed by the strong signals currently being given by short-term moving averages. There is no crossing of moving average by the price or crossing of moving averages between themselves.
In fact, 14 technical indicators on 18 studied are currently bullish. Caution: the Central Indicators scanner currently detects an excess:
CCI indicator is overbought : over 100
Type : Neutral
Timeframe : 1 hour
Pivot points : price is over resistance 2
Type : Neutral
Timeframe : 1 hour
An analysis of the price chart with the Central Patterns scanner (detector of chart patterns and resistances and supports) shows several results that can have an impact on the price change:
Near horizontal resistance
Type : Bearish
Timeframe : 1 hour
Resistance of channel is broken
Type : Bullish
Timeframe : 1 hour
No result was found by the Central Candlesticks scanner on Japanese candlesticks.
| S3 | S2 | S1 | Price | R1 | R2 | R3 | |
|---|---|---|---|---|---|---|---|
| ProTrendLines | 1.6210 | 1.6251 | 1.6307 | 1.6323 | 1.6410 | 1.6550 | 1.6808 |
| Change (%) | -0.69% | -0.44% | -0.10% | - | +0.53% | +1.39% | +2.97% |
| Change | -0.0113 | -0.0072 | -0.0016 | - | +0.0087 | +0.0227 | +0.0485 |
| Level | Intermediate | Major | Minor | - | Minor | Intermediate | Intermediate |
Attention could also be paid to pivot points to set price objectives:
| Pivot points | S3 | S2 | S1 | PP | R1 | R2 | R3 |
|---|---|---|---|---|---|---|---|
| Standard | 1.6083 | 1.6127 | 1.6166 | 1.6210 | 1.6249 | 1.6293 | 1.6332 |
| Camarilla | 1.6183 | 1.6191 | 1.6198 | 1.6206 | 1.6214 | 1.6221 | 1.6229 |
| Woodie | 1.6082 | 1.6126 | 1.6165 | 1.6209 | 1.6248 | 1.6292 | 1.6331 |
| Fibonacci | 1.6127 | 1.6158 | 1.6178 | 1.6210 | 1.6241 | 1.6261 | 1.6293 |
| Pivot points | S3 | S2 | S1 | PP | R1 | R2 | R3 |
|---|---|---|---|---|---|---|---|
| Standard | 1.5760 | 1.5883 | 1.6062 | 1.6185 | 1.6364 | 1.6487 | 1.6666 |
| Camarilla | 1.6159 | 1.6187 | 1.6214 | 1.6242 | 1.6270 | 1.6297 | 1.6325 |
| Woodie | 1.5789 | 1.5897 | 1.6091 | 1.6199 | 1.6393 | 1.6501 | 1.6695 |
| Fibonacci | 1.5883 | 1.5998 | 1.6069 | 1.6185 | 1.6300 | 1.6371 | 1.6487 |
| Pivot points | S3 | S2 | S1 | PP | R1 | R2 | R3 |
|---|---|---|---|---|---|---|---|
| Standard | 1.5326 | 1.5647 | 1.5944 | 1.6265 | 1.6562 | 1.6883 | 1.7180 |
| Camarilla | 1.6072 | 1.6129 | 1.6185 | 1.6242 | 1.6299 | 1.6355 | 1.6412 |
| Woodie | 1.5315 | 1.5641 | 1.5933 | 1.6259 | 1.6551 | 1.6877 | 1.7169 |
| Fibonacci | 1.5647 | 1.5883 | 1.6029 | 1.6265 | 1.6501 | 1.6647 | 1.6883 |
Numerical data
The following are the details of the technical indicators and moving averages that were collected to generate this technical analysis:
| RSI (14): | 67.04 | |
| MACD (12,26,9): | 0.0028 | |
| Directional Movement: | 28.9358 | |
| AROON (14): | 28.5714 | |
| DEMA (21): | 1.6288 | |
| Parabolic SAR (0,02-0,02-0,2): | 1.6223 | |
| Elder Ray (13): | 0.0052 | |
| Super Trend (3,10): | 1.6270 | |
| Zig ZAG (10): | 1.6320 | |
| VORTEX (21): | 1.2834 | |
| Stochastique (14,3,5): | 80.04 | |
| TEMA (21): | 1.6312 | |
| Williams %R (14): | -28.49 | |
| Chande Momentum Oscillator (20): | 0.0097 | |
| Repulse (5,40,3): | 0.0217 | |
| ROCnROLL: | 1 | |
| TRIX (15,9): | 0.0119 | |
| Courbe Coppock: | 0.93 |
| MA7: | 1.6239 | |
| MA20: | 1.6222 | |
| MA50: | 1.6258 | |
| MA100: | 1.6378 | |
| MAexp7: | 1.6300 | |
| MAexp20: | 1.6258 | |
| MAexp50: | 1.6234 | |
| MAexp100: | 1.6223 | |
| Price / MA7: | +0.52% | |
| Price / MA20: | +0.62% | |
| Price / MA50: | +0.40% | |
| Price / MA100: | -0.34% | |
| Price / MAexp7: | +0.15% | |
| Price / MAexp20: | +0.41% | |
| Price / MAexp50: | +0.55% | |
| Price / MAexp100: | +0.62% |
News
Don't forget to follow the news on EUR/AUD. At the time of publication of this analysis, the latest news was as follows:
-
 EUR/AUD Forecast November 14, 2024
-
EUR/AUD Forecast September 25, 2024
-
Both Dollar and S&P 500 Edge Higher after Factory Report, EURAUD A Pair to Watch
-
Weekly Technical Analysis: 19/08/2019 - GBPJPY, USDCAD, EURAUD
-
An Underappreciated Technical and Fundamental Appeal of EURAUD
About author
Online


Add a comment
Comments
0 comments on the analysis EUR/AUD - 1H