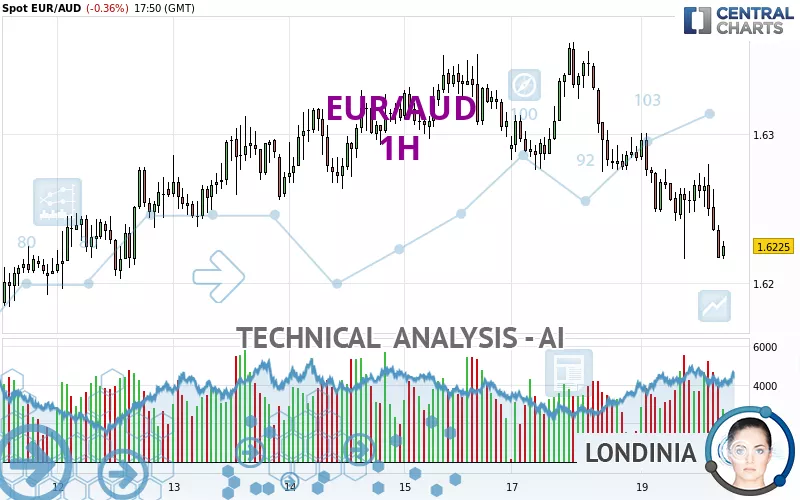
EUR/AUD - 1H - Technical analysis published on 11/19/2024 (GMT)
- 110
- 0
Click here for a new analysis!
- Timeframe : 1H
- - Analysis generated on
- Status : LEVEL MAINTAINED
Summary of the analysis

Additional analysis
Quotes
The EUR/AUD price is 1.6225 AUD. The price registered a decrease of -0.36% on the session with the lowest point at 1.6216 AUD and the highest point at 1.6301 AUD. The deviation from the price is +0.06% for the low point and -0.47% for the high point.The Central Gaps scanner detects a bullish opening marking the presence of buyers ahead of sellers at the opening but not sufficiently marked to allow the price to register a quotation gap.
Bullish opening
Type : Bullish
Timeframe : Openning
A study of price movements over other periods shows the following variations:
Near a new LOW record (1 year)
Type : Bearish
Timeframe : Weekly
Near a new LOW record (1st january)
Type : Bearish
Timeframe : Weekly
Near a new HIGH record (1 month)
Type : Bullish
Timeframe : Weekly
Technical
Technical analysis of EUR/AUD in 1H shows a overall strongly bearish trend. 92.86% of the signals given by moving averages are bearish. The overall trend is supported by the strong bearish signals from short-term moving averages. There is no crossing of moving average by the price or crossing of moving averages between themselves.
The probability of a further decline is moderate given the direction of the technical indicators.
Caution: the Central Indicators scanner currently detects an excess:
CCI indicator is oversold : under -100
Type : Neutral
Timeframe : 1 hour
Previous candle closed under Bollinger bands
Type : Neutral
Timeframe : 1 hour
Williams %R indicator is oversold : under -80
Type : Neutral
Timeframe : 1 hour
Pivot points : price is under support 3
Type : Neutral
Timeframe : 1 hour
Price is back under the pivot point
Type : Bearish
Timeframe : Weekly
The Central Patterns scanner, which studies chart patterns, resistances and supports, has identified these signals:
Horizontal support is broken
Type : Bearish
Timeframe : 1 hour
Support of channel is broken
Type : Bearish
Timeframe : 1 hour
For a small rebound in the very short term, the Central Candlesticks scanner currently notes the presence of this bullish pattern in Japanese candlesticks:
Bullish harami
Type : Bullish
Timeframe : 1 hour
| S3 | S2 | S1 | R1 | Price | R2 | R3 | |
|---|---|---|---|---|---|---|---|
| ProTrendLines | 1.5898 | 1.6043 | 1.6173 | 1.6225 | 1.6225 | 1.6244 | 1.6276 |
| Change (%) | -2.02% | -1.12% | -0.32% | 0% | - | +0.12% | +0.31% |
| Change | -0.0327 | -0.0182 | -0.0052 | 0 | - | +0.0019 | +0.0051 |
| Level | Minor | Major | Major | Minor | - | Major | Major |
Pivot points can also be used to set your price objectives. Here is the price situation in relation to pivot points:
| Pivot points | S3 | S2 | S1 | PP | R1 | R2 | R3 |
|---|---|---|---|---|---|---|---|
| Standard | 1.6165 | 1.6220 | 1.6252 | 1.6307 | 1.6339 | 1.6394 | 1.6426 |
| Camarilla | 1.6260 | 1.6268 | 1.6276 | 1.6284 | 1.6292 | 1.6300 | 1.6308 |
| Woodie | 1.6154 | 1.6214 | 1.6241 | 1.6301 | 1.6328 | 1.6388 | 1.6415 |
| Fibonacci | 1.6220 | 1.6253 | 1.6274 | 1.6307 | 1.6340 | 1.6361 | 1.6394 |
| Pivot points | S3 | S2 | S1 | PP | R1 | R2 | R3 |
|---|---|---|---|---|---|---|---|
| Standard | 1.6041 | 1.6112 | 1.6211 | 1.6282 | 1.6381 | 1.6452 | 1.6551 |
| Camarilla | 1.6262 | 1.6278 | 1.6293 | 1.6309 | 1.6325 | 1.6340 | 1.6356 |
| Woodie | 1.6054 | 1.6119 | 1.6224 | 1.6289 | 1.6394 | 1.6459 | 1.6564 |
| Fibonacci | 1.6112 | 1.6177 | 1.6217 | 1.6282 | 1.6347 | 1.6387 | 1.6452 |
| Pivot points | S3 | S2 | S1 | PP | R1 | R2 | R3 |
|---|---|---|---|---|---|---|---|
| Standard | 1.5571 | 1.5788 | 1.6168 | 1.6385 | 1.6765 | 1.6982 | 1.7362 |
| Camarilla | 1.6385 | 1.6440 | 1.6494 | 1.6549 | 1.6604 | 1.6659 | 1.6713 |
| Woodie | 1.5654 | 1.5829 | 1.6251 | 1.6426 | 1.6848 | 1.7023 | 1.7445 |
| Fibonacci | 1.5788 | 1.6016 | 1.6157 | 1.6385 | 1.6613 | 1.6754 | 1.6982 |
Numerical data
The following is the status of technical indicators and moving averages registered at the time this technical analysis was created:
| RSI (14): | 31.22 | |
| MACD (12,26,9): | -0.0017 | |
| Directional Movement: | -16.3454 | |
| AROON (14): | 35.7143 | |
| DEMA (21): | 1.6237 | |
| Parabolic SAR (0,02-0,02-0,2): | 1.6279 | |
| Elder Ray (13): | -0.0027 | |
| Super Trend (3,10): | 1.6286 | |
| Zig ZAG (10): | 1.6222 | |
| VORTEX (21): | 0.8598 | |
| Stochastique (14,3,5): | 14.06 | |
| TEMA (21): | 1.6229 | |
| Williams %R (14): | -90.63 | |
| Chande Momentum Oscillator (20): | -0.0044 | |
| Repulse (5,40,3): | -0.1913 | |
| ROCnROLL: | 2 | |
| TRIX (15,9): | -0.0129 | |
| Courbe Coppock: | 0.38 |
| MA7: | 1.6266 | |
| MA20: | 1.6353 | |
| MA50: | 1.6304 | |
| MA100: | 1.6368 | |
| MAexp7: | 1.6239 | |
| MAexp20: | 1.6258 | |
| MAexp50: | 1.6279 | |
| MAexp100: | 1.6286 | |
| Price / MA7: | -0.25% | |
| Price / MA20: | -0.78% | |
| Price / MA50: | -0.48% | |
| Price / MA100: | -0.87% | |
| Price / MAexp7: | -0.09% | |
| Price / MAexp20: | -0.20% | |
| Price / MAexp50: | -0.33% | |
| Price / MAexp100: | -0.37% |
News
Don't forget to follow the news on EUR/AUD. At the time of publication of this analysis, the latest news was as follows:
-
 EUR/AUD Forecast November 14, 2024
-
EUR/AUD Forecast September 25, 2024
-
Both Dollar and S&P 500 Edge Higher after Factory Report, EURAUD A Pair to Watch
-
Weekly Technical Analysis: 19/08/2019 - GBPJPY, USDCAD, EURAUD
-
An Underappreciated Technical and Fundamental Appeal of EURAUD
About author

Online


Add a comment
Comments
0 comments on the analysis EUR/AUD - 1H