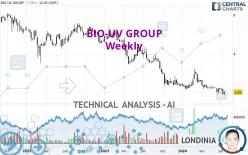
BIO-UV GROUP - Weekly - Technical analysis published on 07/19/2024 (GMT)
- 159
- 0
Click here for a new analysis!
- Timeframe : Weekly
- - Analysis generated on
- Status : TARGET REACHED

Summary of the analysis

Additional analysis
Quotes
BIO-UV GROUP rating 2.030 EUR. Over 5 days, this instrument gained +5.84% and was traded between 1.870 EUR and 2.080 EUR over the period. The price is currently at +8.56% from its lowest point and -2.40% from its highest point.The Central Gaps scanner detects a bullish opening. A small advantage for buyers in the very short term.
Bullish opening
Type : Bullish
Timeframe : Openning
So that you have an overall view of the price change, here is a table showing the variations over several periods:
New LOW record (5 years)
Type : Bearish
Timeframe : Weekly
Near a new LOW record (1 year)
Type : Bearish
Timeframe : Weekly
Near a new LOW record (1st january)
Type : Bearish
Timeframe : Weekly
Near a new LOW record (1 month)
Type : Bearish
Timeframe : Weekly
The Central Volumes scanner notes the presence of abnormal volumes:
Abnormal volumes
Timeframe : 5 days
Technical
Technical analysis of this Weekly chart of BIO-UV GROUP indicates that the overall trend is strongly bearish. The signals given by moving averages are 92.86% bearish. This strong bearish trend is confirmed by the strong signals currently being given by short-term moving averages. The Central Indicators scanner does not detect any result on moving averages that would impact this trend.
Technical indicators are bearish. There is still some doubt about the decline in the price.
Caution: the Central Indicators scanner currently detects an excess:
CCI indicator is oversold : under -100
Type : Neutral
Timeframe : Weekly
RSI indicator: bullish divergence
Type : Bullish
Timeframe : Weekly
Price is back over the pivot point
Type : Bullish
Timeframe : Weekly
No signals are given by Central Patterns, a market scanner specialised in chart patterns, resistances and supports.
The Central Candlesticks scanner which studies Japanese candlesticks did not detect anything.
| Price | R1 | R2 | R3 | |
|---|---|---|---|---|
| ProTrendLines | 2.030 | 2.203 | 3.879 | 5.393 |
| Change (%) | - | +8.52% | +91.08% | +165.67% |
| Change | - | +0.173 | +1.849 | +3.363 |
| Level | - | Intermediate | Intermediate | Intermediate |
Attention could also be paid to pivot points to set price objectives:
| Pivot points | S3 | S2 | S1 | PP | R1 | R2 | R3 |
|---|---|---|---|---|---|---|---|
| Standard | 1.828 | 1.860 | 1.876 | 1.908 | 1.924 | 1.956 | 1.972 |
| Camarilla | 1.879 | 1.883 | 1.888 | 1.892 | 1.896 | 1.901 | 1.905 |
| Woodie | 1.820 | 1.856 | 1.868 | 1.904 | 1.916 | 1.952 | 1.964 |
| Fibonacci | 1.860 | 1.878 | 1.890 | 1.908 | 1.926 | 1.938 | 1.956 |
| Pivot points | S3 | S2 | S1 | PP | R1 | R2 | R3 |
|---|---|---|---|---|---|---|---|
| Standard | 1.535 | 1.719 | 1.818 | 2.002 | 2.101 | 2.285 | 2.384 |
| Camarilla | 1.840 | 1.866 | 1.892 | 1.918 | 1.944 | 1.970 | 1.996 |
| Woodie | 1.494 | 1.698 | 1.777 | 1.981 | 2.060 | 2.264 | 2.343 |
| Fibonacci | 1.719 | 1.827 | 1.894 | 2.002 | 2.110 | 2.177 | 2.285 |
| Pivot points | S3 | S2 | S1 | PP | R1 | R2 | R3 |
|---|---|---|---|---|---|---|---|
| Standard | 1.670 | 1.800 | 2.010 | 2.140 | 2.350 | 2.480 | 2.690 |
| Camarilla | 2.127 | 2.158 | 2.189 | 2.220 | 2.251 | 2.282 | 2.314 |
| Woodie | 1.710 | 1.820 | 2.050 | 2.160 | 2.390 | 2.500 | 2.730 |
| Fibonacci | 1.800 | 1.930 | 2.010 | 2.140 | 2.270 | 2.350 | 2.480 |
Numerical data
The following is the status of the technical indicators and moving averages at the time of publication of this technical analysis:
| RSI (14): | 38.72 | |
| MACD (12,26,9): | -0.1610 | |
| Directional Movement: | -20.045 | |
| AROON (14): | -92.857 | |
| DEMA (21): | 2.044 | |
| Parabolic SAR (0,02-0,02-0,2): | 2.462 | |
| Elder Ray (13): | -0.209 | |
| Super Trend (3,10): | 2.548 | |
| Zig ZAG (10): | 2.030 | |
| VORTEX (21): | 0.8700 | |
| Stochastique (14,3,5): | 21.92 | |
| TEMA (21): | 2.075 | |
| Williams %R (14): | -71.93 | |
| Chande Momentum Oscillator (20): | -0.260 | |
| Repulse (5,40,3): | -3.6490 | |
| ROCnROLL: | 2 | |
| TRIX (15,9): | -0.8220 | |
| Courbe Coppock: | 29.15 |
| MA7: | 1.933 | |
| MA20: | 2.096 | |
| MA50: | 2.163 | |
| MA100: | 2.344 | |
| MAexp7: | 2.107 | |
| MAexp20: | 2.262 | |
| MAexp50: | 2.663 | |
| MAexp100: | 3.258 | |
| Price / MA7: | +5.02% | |
| Price / MA20: | -3.15% | |
| Price / MA50: | -6.15% | |
| Price / MA100: | -13.40% | |
| Price / MAexp7: | -3.65% | |
| Price / MAexp20: | -10.26% | |
| Price / MAexp50: | -23.77% | |
| Price / MAexp100: | -37.69% |
News
The last news published on BIO-UV GROUP at the time of the generation of this analysis was as follows:
- BIO-UV Group strengthens its organisation to support its growth, promote sales of solutions and develop aftersales services
- Sharp increase in 2022 full-year results - Outlook
- Successful transaction for the sale of 1,395,962 shares in BIO-UV Group by its majority shareholder, Benoît Gillmann - Appointment of Laurent-Emmanuel Migeon as Chairman and Chief Executive Officer of BIO-UV Group
- Launch of the sale of 1,395,962 shares in BIO-UV Group initiated by its majority shareholder, Benoît Gillmann - Proposal to change BIO-UV Group's governance structure with the appointment of Laurent-Emmanuel Migeon as Chairman and Chief Executive Officer
- Full year turnover of EUR 51.5m with steep growth of +54% of which 16% organic
About author

Online


Add a comment
Comments
0 comments on the analysis BIO-UV GROUP - Weekly