| Open: | 8.7993 |
| Change: | -0.0058 |
| Volume: | 29,650 |
| Low: | 8.7885 |
| High: | 8.8331 |
| High / Low range: | 0.0446 |
| Type: | Forex |
| Ticker: | AUDNOK |
| ISIN: |
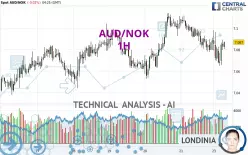
AUD/NOK - 1H - Technical analysis published on 02/24/2025 (GMT)
- 98
- 0
- 02/24/2025 - 04:25
Click here for a new analysis!
- Timeframe : 1H
- - Analysis generated on 02/24/2025 - 04:25
- Status : INVALID

Summary of the analysis

Additional analysis
Quotes
The AUD/NOK price is 7.0872 NOK. The price is lower by -0.02% since the last closing and was between 7.0651 NOK and 7.0981 NOK. This implies that the price is at +0.31% from its lowest and at -0.15% from its highest.The Central Gaps scanner detects a bearish opening. A small advantage for sellers in the very short term.
Bearish opening
Type : Bearish
Timeframe : Openning
So that you have an overall view of the price change, here is a table showing the variations over several periods:
Near a new HIGH record (5 years)
Type : Bullish
Timeframe : Weekly
Near a new HIGH record (1 year)
Type : Bullish
Timeframe : Weekly
Near a new LOW record (1st january)
Type : Bearish
Timeframe : Weekly
Near a new LOW record (1 month)
Type : Bearish
Timeframe : Weekly
Technical
Technical analysis of this 1H chart of AUD/NOK indicates that the overall trend is bullish. The signals given by moving averages are 67.86% bullish. This bullish trend is slowing down slightly given the slightly bullish signals of short-term moving averages. The Central Indicators scanner detects bullish signals on moving averages that could impact this trend:
Bullish price crossover with Moving Average 20
Type : Bullish
Timeframe : 1 hour
Bullish price crossover with Moving Average 100
Type : Bullish
Timeframe : 1 hour
The probability of a further increase are moderate given the direction of the technical indicators.
Central Indicators, the scanner specialised in technical indicators, has identified this signal:
Momentum indicator is back over 0
Type : Bullish
Timeframe : 1 hour
No signals are given by Central Patterns, a market scanner specialised in chart patterns, resistances and supports.
Central Candlesticks, the scanner specialised in Japanese candlesticks, detects a bullish signal that could support the hypothesis of a small rebound in the very short term:
Bullish engulfing lines
Type : Bullish
Timeframe : 1 hour
| S3 | S2 | S1 | Price | R1 | R2 | R3 | |
|---|---|---|---|---|---|---|---|
| ProTrendLines | 7.0533 | 7.0718 | 7.0857 | 7.0872 | 7.0954 | 7.1043 | 7.1141 |
| Change (%) | -0.48% | -0.22% | -0.02% | - | +0.12% | +0.24% | +0.38% |
| Change | -0.0339 | -0.0154 | -0.0015 | - | +0.0082 | +0.0171 | +0.0269 |
| Level | Major | Minor | Intermediate | - | Intermediate | Minor | Intermediate |
Attention could also be paid to pivot points to set price objectives:
| Pivot points | S3 | S2 | S1 | PP | R1 | R2 | R3 |
|---|---|---|---|---|---|---|---|
| Standard | 7.0400 | 7.0590 | 7.0737 | 7.0927 | 7.1074 | 7.1264 | 7.1411 |
| Camarilla | 7.0790 | 7.0821 | 7.0852 | 7.0883 | 7.0914 | 7.0945 | 7.0976 |
| Woodie | 7.0378 | 7.0579 | 7.0715 | 7.0916 | 7.1052 | 7.1253 | 7.1389 |
| Fibonacci | 7.0590 | 7.0719 | 7.0799 | 7.0927 | 7.1056 | 7.1136 | 7.1264 |
| Pivot points | S3 | S2 | S1 | PP | R1 | R2 | R3 |
|---|---|---|---|---|---|---|---|
| Standard | 6.9802 | 7.0122 | 7.0502 | 7.0822 | 7.1202 | 7.1522 | 7.1902 |
| Camarilla | 7.0691 | 7.0755 | 7.0819 | 7.0883 | 7.0947 | 7.1011 | 7.1076 |
| Woodie | 6.9833 | 7.0137 | 7.0533 | 7.0837 | 7.1233 | 7.1537 | 7.1933 |
| Fibonacci | 7.0122 | 7.0389 | 7.0554 | 7.0822 | 7.1089 | 7.1254 | 7.1522 |
| Pivot points | S3 | S2 | S1 | PP | R1 | R2 | R3 |
|---|---|---|---|---|---|---|---|
| Standard | 6.9062 | 6.9620 | 6.9997 | 7.0555 | 7.0932 | 7.1490 | 7.1867 |
| Camarilla | 7.0117 | 7.0203 | 7.0288 | 7.0374 | 7.0460 | 7.0545 | 7.0631 |
| Woodie | 6.8972 | 6.9575 | 6.9907 | 7.0510 | 7.0842 | 7.1445 | 7.1777 |
| Fibonacci | 6.9620 | 6.9977 | 7.0198 | 7.0555 | 7.0912 | 7.1133 | 7.1490 |
Numerical data
The following are the details of the technical indicators and moving averages that were collected to generate this technical analysis:
| RSI (14): | 50.31 | |
| MACD (12,26,9): | -0.0034 | |
| Directional Movement: | 1.3494 | |
| AROON (14): | -28.5714 | |
| DEMA (21): | 7.0800 | |
| Parabolic SAR (0,02-0,02-0,2): | 7.0893 | |
| Elder Ray (13): | 0.0017 | |
| Super Trend (3,10): | 7.1070 | |
| Zig ZAG (10): | 7.0859 | |
| VORTEX (21): | 0.9555 | |
| Stochastique (14,3,5): | 58.79 | |
| TEMA (21): | 7.0770 | |
| Williams %R (14): | -37.88 | |
| Chande Momentum Oscillator (20): | 0.0032 | |
| Repulse (5,40,3): | 0.0974 | |
| ROCnROLL: | 1 | |
| TRIX (15,9): | -0.0077 | |
| Courbe Coppock: | 0.26 |
| MA7: | 7.0788 | |
| MA20: | 7.0594 | |
| MA50: | 7.0680 | |
| MA100: | 7.1415 | |
| MAexp7: | 7.0811 | |
| MAexp20: | 7.0842 | |
| MAexp50: | 7.0862 | |
| MAexp100: | 7.0824 | |
| Price / MA7: | +0.12% | |
| Price / MA20: | +0.39% | |
| Price / MA50: | +0.27% | |
| Price / MA100: | -0.76% | |
| Price / MAexp7: | +0.09% | |
| Price / MAexp20: | +0.04% | |
| Price / MAexp50: | +0.01% | |
| Price / MAexp100: | +0.07% |
About author
Online


Add a comment
Comments
0 comments on the analysis AUD/NOK - 1H