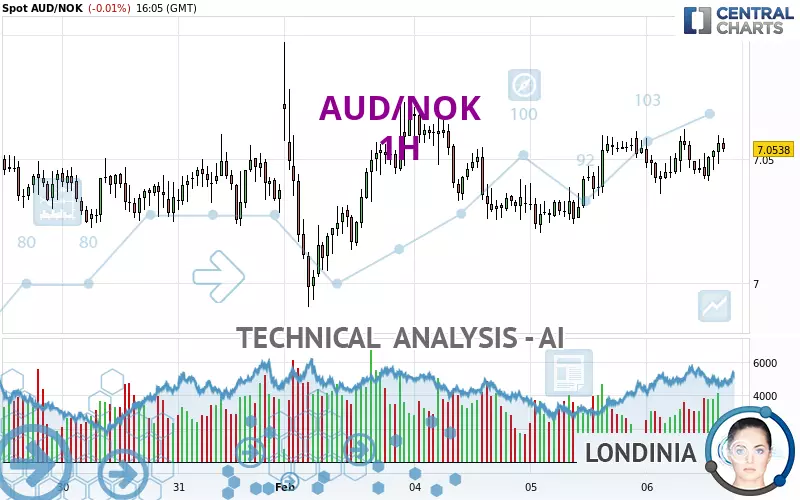
AUD/NOK - 1H - Technical analysis published on 02/06/2025 (GMT)
- 130
- 0
Click here for a new analysis!
- Timeframe : 1H
- - Analysis generated on
- Status : INVALID
Summary of the analysis

Additional analysis
Quotes
The AUD/NOK price is 7.0540 NOK. On the day, this instrument lost -0.01% and was between 7.0357 NOK and 7.0620 NOK. This implies that the price is at +0.26% from its lowest and at -0.11% from its highest.A bearish opening was detected by the Central Gaps scanner. Sellers are trying to impose a bearish trend in the very short term.
Bearish opening
Type : Bearish
Timeframe : Openning
Here is a more detailed summary of the historical variations registered by AUD/NOK:
Near a new HIGH record (5 years)
Type : Bullish
Timeframe : Weekly
Near a new HIGH record (1 year)
Type : Bullish
Timeframe : Weekly
Near a new HIGH record (1st january)
Type : Bullish
Timeframe : Weekly
Near a new HIGH record (1 month)
Type : Bullish
Timeframe : Weekly
Technical
Technical analysis of AUD/NOK in 1H shows a strongly overall bullish trend. 89.29% of the signals given by moving averages are bullish. The slightly bullish signals given by the short-term moving averages show a weakening of the global trend. The Central Indicators market scanner is currently detecting several bearish signals that could impact this trend:
Moving Average bearish crossovers : MA50 & MA100
Type : Bearish
Timeframe : 1 hour
Bearish price crossover with Moving Average 20
Type : Bearish
Timeframe : 1 hour
In fact, only 8 technical indicators out of 18 studied are currently positioned bullish. Caution: the Central Indicators scanner currently detects an excess:
Williams %R indicator is overbought : over -20
Type : Neutral
Timeframe : 1 hour
MACD crosses UP its Moving Average
Type : Bullish
Timeframe : 1 hour
Central Patterns, the market scanner focusing on chart patterns, resistances and supports found this result:
Near resistance of channel
Type : Bearish
Timeframe : 1 hour
The Central Candlesticks scanner which studies Japanese candlesticks did not detect anything.
| S3 | S2 | S1 | Price | R1 | R2 | R3 | |
|---|---|---|---|---|---|---|---|
| ProTrendLines | 7.0242 | 7.0327 | 7.0450 | 7.0540 | 7.0598 | 7.0815 | 7.0954 |
| Change (%) | -0.42% | -0.30% | -0.13% | - | +0.08% | +0.39% | +0.59% |
| Change | -0.0298 | -0.0213 | -0.0090 | - | +0.0058 | +0.0275 | +0.0414 |
| Level | Major | Minor | Major | - | Intermediate | Intermediate | Major |
To determine price objectives, it is also possible to use the pivot points. Here is the price position in relation to pivot points:
| Pivot points | S3 | S2 | S1 | PP | R1 | R2 | R3 |
|---|---|---|---|---|---|---|---|
| Standard | 6.9883 | 7.0042 | 7.0293 | 7.0452 | 7.0703 | 7.0862 | 7.1113 |
| Camarilla | 7.0431 | 7.0469 | 7.0506 | 7.0544 | 7.0582 | 7.0619 | 7.0657 |
| Woodie | 6.9929 | 7.0065 | 7.0339 | 7.0475 | 7.0749 | 7.0885 | 7.1159 |
| Fibonacci | 7.0042 | 7.0199 | 7.0295 | 7.0452 | 7.0609 | 7.0705 | 7.0862 |
| Pivot points | S3 | S2 | S1 | PP | R1 | R2 | R3 |
|---|---|---|---|---|---|---|---|
| Standard | 6.9451 | 6.9815 | 7.0094 | 7.0458 | 7.0737 | 7.1101 | 7.1380 |
| Camarilla | 7.0197 | 7.0256 | 7.0315 | 7.0374 | 7.0433 | 7.0492 | 7.0551 |
| Woodie | 6.9410 | 6.9794 | 7.0053 | 7.0437 | 7.0696 | 7.1080 | 7.1339 |
| Fibonacci | 6.9815 | 7.0060 | 7.0212 | 7.0458 | 7.0703 | 7.0855 | 7.1101 |
| Pivot points | S3 | S2 | S1 | PP | R1 | R2 | R3 |
|---|---|---|---|---|---|---|---|
| Standard | 6.9062 | 6.9620 | 6.9997 | 7.0555 | 7.0932 | 7.1490 | 7.1867 |
| Camarilla | 7.0117 | 7.0203 | 7.0288 | 7.0374 | 7.0460 | 7.0545 | 7.0631 |
| Woodie | 6.8972 | 6.9575 | 6.9907 | 7.0510 | 7.0842 | 7.1445 | 7.1777 |
| Fibonacci | 6.9620 | 6.9977 | 7.0198 | 7.0555 | 7.0912 | 7.1133 | 7.1490 |
Numerical data
The following is the status of technical indicators and moving averages registered at the time this technical analysis was created:
| RSI (14): | 52.48 | |
| MACD (12,26,9): | 0.0014 | |
| Directional Movement: | -2.8451 | |
| AROON (14): | 35.7143 | |
| DEMA (21): | 7.0500 | |
| Parabolic SAR (0,02-0,02-0,2): | 7.0410 | |
| Elder Ray (13): | -0.0001 | |
| Super Trend (3,10): | 7.0308 | |
| Zig ZAG (10): | 7.0485 | |
| VORTEX (21): | 0.9618 | |
| Stochastique (14,3,5): | 44.99 | |
| TEMA (21): | 7.0494 | |
| Williams %R (14): | -51.33 | |
| Chande Momentum Oscillator (20): | 0.0066 | |
| Repulse (5,40,3): | 0.0286 | |
| ROCnROLL: | 1 | |
| TRIX (15,9): | 0.0044 | |
| Courbe Coppock: | 0.06 |
| MA7: | 7.0453 | |
| MA20: | 7.0607 | |
| MA50: | 7.0870 | |
| MA100: | 7.1599 | |
| MAexp7: | 7.0482 | |
| MAexp20: | 7.0477 | |
| MAexp50: | 7.0449 | |
| MAexp100: | 7.0440 | |
| Price / MA7: | +0.12% | |
| Price / MA20: | -0.09% | |
| Price / MA50: | -0.47% | |
| Price / MA100: | -1.48% | |
| Price / MAexp7: | +0.08% | |
| Price / MAexp20: | +0.09% | |
| Price / MAexp50: | +0.13% | |
| Price / MAexp100: | +0.14% |
About author
Online


Add a comment
Comments
0 comments on the analysis AUD/NOK - 1H