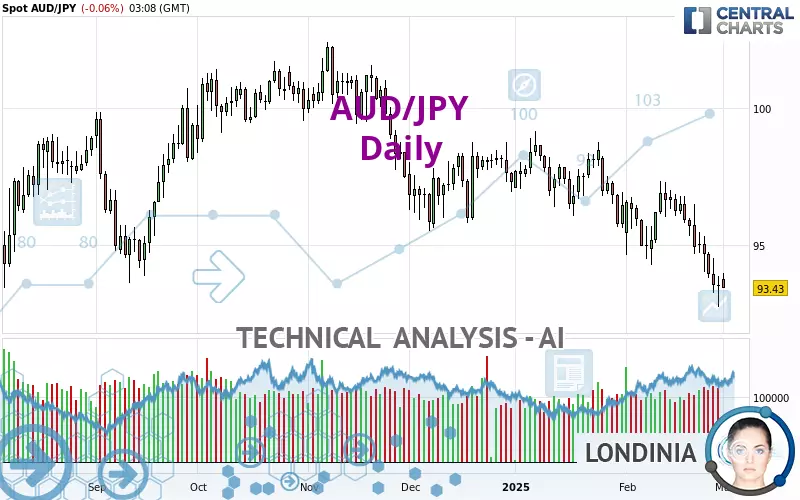
AUD/JPY - Daily - Technical analysis published on 03/03/2025 (GMT)
- 176
- 0
- Timeframe : Daily
- - Analysis generated on
- Status : IN PROGRESS...

Summary of the analysis

Additional analysis
Quotes
The AUD/JPY rating is 93.43 JPY. The price registered a decrease of -0.06% on the session with the lowest point at 93.41 JPY and the highest point at 93.96 JPY. The deviation from the price is +0.02% for the low point and -0.56% for the high point.The Central Gaps scanner detects a bullish opening. A small advantage for buyers in the very short term.
Bullish opening
Type : Bullish
Timeframe : Openning
Here is a more detailed summary of the historical variations registered by AUD/JPY:
Near a new LOW record (1 year)
Type : Bearish
Timeframe : Weekly
Near a new LOW record (1st january)
Type : Bearish
Timeframe : Weekly
Near a new HIGH record (1 month)
Type : Bullish
Timeframe : Weekly
Technical
Technical analysis of this Daily chart of AUD/JPY indicates that the overall trend is strongly bearish. 92.86% of the signals given by moving averages are bearish. The overall trend is supported by the strong bearish signals from short-term moving averages. The Central Indicators scanner does not detect any result on moving averages that would impact this trend.
In fact, of the 18 technical indicators analysed by Central Analyzer, 4 are bullish, 2 are neutral and 12 are bearish. But beware of excesses. The Central Indicators scanner currently detects this:
CCI indicator is oversold : under -100
Type : Neutral
Timeframe : Daily
Williams %R indicator is oversold : under -80
Type : Neutral
Timeframe : Daily
An analysis of the price chart with the Central Patterns scanner (detector of chart patterns and resistances and supports) shows a result that can have an impact on the price change:
Near support of channel
Type : Bullish
Timeframe : Daily
No result was found by the Central Candlesticks scanner on Japanese candlesticks.
| S3 | S2 | S1 | Price | R1 | R2 | R3 | |
|---|---|---|---|---|---|---|---|
| ProTrendLines | 80.35 | 84.13 | 86.75 | 93.43 | 94.29 | 98.28 | 102.24 |
| Change (%) | -14.00% | -9.95% | -7.15% | - | +0.92% | +5.19% | +9.43% |
| Change | -13.08 | -9.30 | -6.68 | - | +0.86 | +4.85 | +8.81 |
| Level | Intermediate | Minor | Major | - | Major | Major | Intermediate |
To determine price objectives, it is also possible to use the pivot points. Here is the price position in relation to pivot points:
| Pivot points | S3 | S2 | S1 | PP | R1 | R2 | R3 |
|---|---|---|---|---|---|---|---|
| Standard | 91.72 | 92.22 | 92.86 | 93.36 | 94.00 | 94.50 | 95.14 |
| Camarilla | 93.18 | 93.28 | 93.39 | 93.49 | 93.60 | 93.70 | 93.80 |
| Woodie | 91.78 | 92.26 | 92.92 | 93.40 | 94.06 | 94.54 | 95.20 |
| Fibonacci | 92.22 | 92.66 | 92.93 | 93.36 | 93.80 | 94.07 | 94.50 |
| Pivot points | S3 | S2 | S1 | PP | R1 | R2 | R3 |
|---|---|---|---|---|---|---|---|
| Standard | 89.60 | 91.16 | 92.33 | 93.89 | 95.06 | 96.62 | 97.79 |
| Camarilla | 92.74 | 92.99 | 93.24 | 93.49 | 93.74 | 93.99 | 94.24 |
| Woodie | 89.40 | 91.06 | 92.13 | 93.79 | 94.86 | 96.52 | 97.59 |
| Fibonacci | 91.16 | 92.21 | 92.85 | 93.89 | 94.94 | 95.58 | 96.62 |
| Pivot points | S3 | S2 | S1 | PP | R1 | R2 | R3 |
|---|---|---|---|---|---|---|---|
| Standard | 87.10 | 89.92 | 91.70 | 94.52 | 96.30 | 99.12 | 100.90 |
| Camarilla | 92.23 | 92.65 | 93.07 | 93.49 | 93.91 | 94.33 | 94.76 |
| Woodie | 86.59 | 89.66 | 91.19 | 94.26 | 95.79 | 98.86 | 100.39 |
| Fibonacci | 89.92 | 91.67 | 92.76 | 94.52 | 96.27 | 97.36 | 99.12 |
Numerical data
The following is the status of the technical indicators and moving averages at the time of publication of this technical analysis:
| RSI (14): | 31.61 | |
| MACD (12,26,9): | -0.8400 | |
| Directional Movement: | -20.43 | |
| AROON (14): | -85.72 | |
| DEMA (21): | 94.19 | |
| Parabolic SAR (0,02-0,02-0,2): | 96.22 | |
| Elder Ray (13): | -1.00 | |
| Super Trend (3,10): | 96.55 | |
| Zig ZAG (10): | 93.63 | |
| VORTEX (21): | 0.9100 | |
| Stochastique (14,3,5): | 14.16 | |
| TEMA (21): | 93.79 | |
| Williams %R (14): | -80.87 | |
| Chande Momentum Oscillator (20): | -3.01 | |
| Repulse (5,40,3): | -1.0000 | |
| ROCnROLL: | 2 | |
| TRIX (15,9): | -0.0900 | |
| Courbe Coppock: | 3.59 |
| MA7: | 94.16 | |
| MA20: | 95.37 | |
| MA50: | 96.67 | |
| MA100: | 98.06 | |
| MAexp7: | 94.17 | |
| MAexp20: | 95.21 | |
| MAexp50: | 96.36 | |
| MAexp100: | 97.40 | |
| Price / MA7: | -0.78% | |
| Price / MA20: | -2.03% | |
| Price / MA50: | -3.35% | |
| Price / MA100: | -4.72% | |
| Price / MAexp7: | -0.79% | |
| Price / MAexp20: | -1.87% | |
| Price / MAexp50: | -3.04% | |
| Price / MAexp100: | -4.08% |
News
Don't forget to follow the news on AUD/JPY. At the time of publication of this analysis, the latest news was as follows:
-
 AUD/JPY Forecast November 21, 2024
-
AUD/JPY Forecast November 15, 2024
-
AUD/JPY Forecast November 6, 2024
-
AUD/JPY Forecast October 21, 2024
-
AUD/JPY Forecast October 17, 2024
About author

Online


Add a comment
Comments
0 comments on the analysis AUD/JPY - Daily