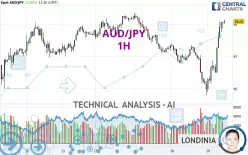
AUD/JPY - 1H - Technical analysis published on 12/19/2024 (GMT)
- 125
- 0
Click here for a new analysis!
- Timeframe : 1H
- - Analysis generated on
- Status : TARGET REACHED

Summary of the analysis

Additional analysis
Quotes
AUD/JPY rating 98.09 JPY. On the day, this instrument gained +2.20% with the lowest point at 95.90 JPY and the highest point at 98.16 JPY. The deviation from the price is +2.28% for the low point and -0.07% for the high point.A study of price movements over other periods shows the following variations:
Near a new HIGH record (1 month)
Type : Bullish
Timeframe : Weekly
Technical
Technical analysis of AUD/JPY in 1H shows an overall bullish trend. The signals returned by the moving averages are 75.00% bullish. This bullish trend is reinforced by the strong signals currently being given by short-term moving averages. The Central Indicators scanner does not detect any result on moving averages that would impact this trend.
Technical indicators are strongly bullish, suggesting that the price increase should continue.
Caution: the Central Indicators scanner currently detects an excess:
RSI indicator is overbought : over 70
Type : Neutral
Timeframe : 1 hour
CCI indicator is overbought : over 100
Type : Neutral
Timeframe : 1 hour
Williams %R indicator is overbought : over -20
Type : Neutral
Timeframe : 1 hour
Pivot points : price is over resistance 2
Type : Neutral
Timeframe : 1 hour
The Central Patterns scanner, which studies chart patterns, resistances and supports, has identified these signals:
Near horizontal resistance
Type : Bearish
Timeframe : 1 hour
Resistance of channel is broken
Type : Bullish
Timeframe : 1 hour
The Central Candlesticks scanner, specialised in Japanese candlesticks, did not identify any signals.
| S3 | S2 | S1 | Price | R1 | R2 | R3 | |
|---|---|---|---|---|---|---|---|
| ProTrendLines | 96.80 | 97.36 | 98.06 | 98.09 | 98.28 | 99.59 | 102.24 |
| Change (%) | -1.32% | -0.74% | -0.03% | - | +0.19% | +1.53% | +4.23% |
| Change | -1.29 | -0.73 | -0.03 | - | +0.19 | +1.50 | +4.15 |
| Level | Intermediate | Intermediate | Intermediate | - | Major | Intermediate | Intermediate |
Attention could also be paid to pivot points to set price objectives:
| Pivot points | S3 | S2 | S1 | PP | R1 | R2 | R3 |
|---|---|---|---|---|---|---|---|
| Standard | 93.76 | 94.78 | 95.38 | 96.40 | 97.00 | 98.02 | 98.62 |
| Camarilla | 95.54 | 95.68 | 95.83 | 95.98 | 96.13 | 96.28 | 96.43 |
| Woodie | 93.55 | 94.68 | 95.17 | 96.30 | 96.79 | 97.92 | 98.41 |
| Fibonacci | 94.78 | 95.40 | 95.78 | 96.40 | 97.02 | 97.40 | 98.02 |
| Pivot points | S3 | S2 | S1 | PP | R1 | R2 | R3 |
|---|---|---|---|---|---|---|---|
| Standard | 93.81 | 94.71 | 96.26 | 97.16 | 98.71 | 99.61 | 101.16 |
| Camarilla | 97.14 | 97.36 | 97.59 | 97.81 | 98.04 | 98.26 | 98.48 |
| Woodie | 94.14 | 94.87 | 96.59 | 97.32 | 99.04 | 99.77 | 101.49 |
| Fibonacci | 94.71 | 95.65 | 96.22 | 97.16 | 98.10 | 98.67 | 99.61 |
| Pivot points | S3 | S2 | S1 | PP | R1 | R2 | R3 |
|---|---|---|---|---|---|---|---|
| Standard | 90.86 | 94.15 | 95.82 | 99.11 | 100.78 | 104.07 | 105.74 |
| Camarilla | 96.12 | 96.57 | 97.03 | 97.48 | 97.94 | 98.39 | 98.84 |
| Woodie | 90.04 | 93.75 | 95.00 | 98.71 | 99.96 | 103.67 | 104.92 |
| Fibonacci | 94.15 | 96.05 | 97.22 | 99.11 | 101.01 | 102.18 | 104.07 |
Numerical data
The following are the details of the technical indicators and moving averages that were collected to generate this technical analysis:
| RSI (14): | 72.15 | |
| MACD (12,26,9): | 0.2500 | |
| Directional Movement: | 22.05 | |
| AROON (14): | 85.71 | |
| DEMA (21): | 97.42 | |
| Parabolic SAR (0,02-0,02-0,2): | 96.49 | |
| Elder Ray (13): | 0.73 | |
| Super Trend (3,10): | 97.15 | |
| Zig ZAG (10): | 98.10 | |
| VORTEX (21): | 1.1300 | |
| Stochastique (14,3,5): | 96.85 | |
| TEMA (21): | 97.77 | |
| Williams %R (14): | -2.97 | |
| Chande Momentum Oscillator (20): | 2.12 | |
| Repulse (5,40,3): | 0.5000 | |
| ROCnROLL: | 1 | |
| TRIX (15,9): | 0.0000 | |
| Courbe Coppock: | 2.33 |
| MA7: | 97.41 | |
| MA20: | 97.65 | |
| MA50: | 99.45 | |
| MA100: | 98.54 | |
| MAexp7: | 97.69 | |
| MAexp20: | 97.20 | |
| MAexp50: | 97.18 | |
| MAexp100: | 97.27 | |
| Price / MA7: | +0.70% | |
| Price / MA20: | +0.45% | |
| Price / MA50: | -1.37% | |
| Price / MA100: | -0.46% | |
| Price / MAexp7: | +0.41% | |
| Price / MAexp20: | +0.92% | |
| Price / MAexp50: | +0.94% | |
| Price / MAexp100: | +0.84% |
News
The last news published on AUD/JPY at the time of the generation of this analysis was as follows:
-
 AUD/JPY Forecast November 21, 2024
-
AUD/JPY Forecast November 15, 2024
-
AUD/JPY Forecast November 6, 2024
-
AUD/JPY Forecast October 21, 2024
-
AUD/JPY Forecast October 17, 2024
About author
Online


Add a comment
Comments
0 comments on the analysis AUD/JPY - 1H