| Open: | - |
| Change: | - |
| Volume: | - |
| Low: | - |
| High: | - |
| High / Low range: | - |
| Type: | Forex |
| Ticker: | AUDHKD |
| ISIN: |
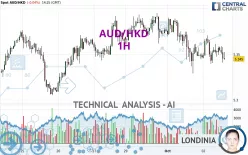
AUD/HKD - 1H - Technical analysis published on 10/02/2024 (GMT)
- 114
- 0
- 10/02/2024 - 14:25
Click here for a new analysis!
- Timeframe : 1H
- - Analysis generated on 10/02/2024 - 14:25
- Status : TARGET REACHED

Summary of the analysis

Additional analysis
Quotes
AUD/HKD rating 5.3450 HKD. On the day, this instrument lost -0.04% and was between 5.3397 HKD and 5.3708 HKD. This implies that the price is at +0.10% from its lowest and at -0.48% from its highest.The Central Gaps scanner detects a bearish opening. A small advantage for sellers in the very short term.
Bearish opening
Type : Bearish
Timeframe : Openning
A study of price movements over other periods shows the following variations:
Near a new HIGH record (1 year)
Type : Bullish
Timeframe : Weekly
Near a new HIGH record (1st january)
Type : Bullish
Timeframe : Weekly
Near a new LOW record (1 month)
Type : Bearish
Timeframe : Weekly
Technical
Technical analysis of AUD/HKD in 1H shows a overall strongly bearish trend. The signals given by moving averages are 89.29% bearish. This strong bearish trend is confirmed by the strong signals currently being given by short-term moving averages. The Central Indicators scanner detects bearish signals on moving averages that could impact this trend:
Bearish trend reversal : Moving Average 20
Type : Bearish
Timeframe : 1 hour
Bearish trend reversal : Moving Average 100
Type : Bearish
Timeframe : 1 hour
In fact, 10 technical indicators on 18 studied are currently positioned bearish. Caution: the Central Indicators scanner currently detects an excess:
CCI indicator is oversold : under -100
Type : Neutral
Timeframe : 1 hour
Price is back under the pivot point
Type : Bearish
Timeframe : Weekly
The analysis of the price chart with Central Patterns scanners does not return any result.
Central Candlesticks, the scanner specialised in Japanese candlesticks, detects a bullish signal that could support the hypothesis of a small rebound in the very short term:
Bullish harami
Type : Bullish
Timeframe : 1 hour
| S3 | S2 | S1 | Price | R1 | R2 | R3 | |
|---|---|---|---|---|---|---|---|
| ProTrendLines | 5.2974 | 5.3201 | 5.3432 | 5.3450 | 5.3516 | 5.3617 | 5.3766 |
| Change (%) | -0.89% | -0.47% | -0.03% | - | +0.12% | +0.31% | +0.59% |
| Change | -0.0476 | -0.0249 | -0.0018 | - | +0.0066 | +0.0167 | +0.0316 |
| Level | Major | Minor | Minor | - | Major | Intermediate | Minor |
To determine price objectives, it is also possible to use the pivot points. Here is the price position in relation to pivot points:
| Pivot points | S3 | S2 | S1 | PP | R1 | R2 | R3 |
|---|---|---|---|---|---|---|---|
| Standard | 5.2596 | 5.2943 | 5.3208 | 5.3555 | 5.3820 | 5.4167 | 5.4432 |
| Camarilla | 5.3304 | 5.3360 | 5.3416 | 5.3472 | 5.3528 | 5.3584 | 5.3640 |
| Woodie | 5.2554 | 5.2923 | 5.3166 | 5.3535 | 5.3778 | 5.4147 | 5.4390 |
| Fibonacci | 5.2943 | 5.3177 | 5.3322 | 5.3555 | 5.3789 | 5.3934 | 5.4167 |
| Pivot points | S3 | S2 | S1 | PP | R1 | R2 | R3 |
|---|---|---|---|---|---|---|---|
| Standard | 5.2091 | 5.2512 | 5.3078 | 5.3499 | 5.4065 | 5.4486 | 5.5052 |
| Camarilla | 5.3373 | 5.3463 | 5.3554 | 5.3644 | 5.3735 | 5.3825 | 5.3915 |
| Woodie | 5.2164 | 5.2548 | 5.3151 | 5.3535 | 5.4138 | 5.4522 | 5.5125 |
| Fibonacci | 5.2512 | 5.2889 | 5.3122 | 5.3499 | 5.3876 | 5.4109 | 5.4486 |
| Pivot points | S3 | S2 | S1 | PP | R1 | R2 | R3 |
|---|---|---|---|---|---|---|---|
| Standard | 4.9973 | 5.0808 | 5.2283 | 5.3118 | 5.4593 | 5.5428 | 5.6903 |
| Camarilla | 5.3122 | 5.3334 | 5.3545 | 5.3757 | 5.3969 | 5.4181 | 5.4392 |
| Woodie | 5.0292 | 5.0968 | 5.2602 | 5.3278 | 5.4912 | 5.5588 | 5.7222 |
| Fibonacci | 5.0808 | 5.1691 | 5.2236 | 5.3118 | 5.4001 | 5.4546 | 5.5428 |
Numerical data
The following is the status of the technical indicators and moving averages at the time of publication of this technical analysis:
| RSI (14): | 44.20 | |
| MACD (12,26,9): | -0.0035 | |
| Directional Movement: | -11.1466 | |
| AROON (14): | -14.2857 | |
| DEMA (21): | 5.3495 | |
| Parabolic SAR (0,02-0,02-0,2): | 5.3702 | |
| Elder Ray (13): | -0.0038 | |
| Super Trend (3,10): | 5.3799 | |
| Zig ZAG (10): | 5.3512 | |
| VORTEX (21): | 1.0780 | |
| Stochastique (14,3,5): | 32.15 | |
| TEMA (21): | 5.3497 | |
| Williams %R (14): | -68.17 | |
| Chande Momentum Oscillator (20): | -0.0162 | |
| Repulse (5,40,3): | -0.0673 | |
| ROCnROLL: | 2 | |
| TRIX (15,9): | -0.0107 | |
| Courbe Coppock: | 0.06 |
| MA7: | 5.3545 | |
| MA20: | 5.2857 | |
| MA50: | 5.2243 | |
| MA100: | 5.2155 | |
| MAexp7: | 5.3508 | |
| MAexp20: | 5.3536 | |
| MAexp50: | 5.3598 | |
| MAexp100: | 5.3590 | |
| Price / MA7: | -0.18% | |
| Price / MA20: | +1.12% | |
| Price / MA50: | +2.31% | |
| Price / MA100: | +2.48% | |
| Price / MAexp7: | -0.11% | |
| Price / MAexp20: | -0.16% | |
| Price / MAexp50: | -0.28% | |
| Price / MAexp100: | -0.26% |
About author
Online


Add a comment
Comments
0 comments on the analysis AUD/HKD - 1H