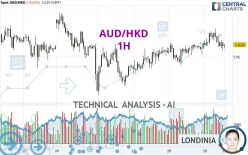
AUD/HKD - 1H - Technical analysis published on 11/29/2024 (GMT)
- 114
- 0
- Timeframe : 1H
- - Analysis generated on
- Status : NEUTRAL

Summary of the analysis

Additional analysis
Quotes
The AUD/HKD rating is 5.0632 HKD. The price registered a decrease of -0.03% on the session and was between 5.0569 HKD and 5.0806 HKD. This implies that the price is at +0.12% from its lowest and at -0.34% from its highest.Here is a more detailed summary of the historical variations registered by AUD/HKD:
Near a new LOW record (1 year)
Type : Bearish
Timeframe : Weekly
Near a new LOW record (1st january)
Type : Bearish
Timeframe : Weekly
Near a new HIGH record (1 month)
Type : Bullish
Timeframe : Weekly
Technical
A technical analysis in 1H of this AUD/HKD chart shows a slightly bullish trend. 60.71% of the signals given by moving averages are bullish. As the signals currently given by short-term moving averages are rather neutral, the overall trend could quickly return to neutral as well. The Central Indicators market scanner is currently detecting several bearish signals that could impact this trend:
Bearish trend reversal : Moving Average 20
Type : Bearish
Timeframe : 1 hour
Bearish price crossover with adaptative moving average 50
Type : Bearish
Timeframe : 1 hour
Bearish price crossover with adaptative moving average 100
Type : Bearish
Timeframe : 1 hour
An assessment of technical indicators does not currently provide any relevant information to suggest whether the signal given by the technical indicators is more bullish or bearish.
But beware of excesses. The Central Indicators scanner currently detects this:
Williams %R indicator is oversold : under -80
Type : Neutral
Timeframe : 1 hour
An analysis of the price chart with the Central Patterns scanner (detector of chart patterns and resistances and supports) shows several results that can have an impact on the price change:
Near horizontal support
Type : Bullish
Timeframe : 1 hour
Support of channel is broken
Type : Bearish
Timeframe : 1 hour
The Central Candlesticks scanner, specialised in Japanese candlesticks, did not identify any signals.
| S3 | S2 | S1 | Price | R1 | R2 | R3 | |
|---|---|---|---|---|---|---|---|
| ProTrendLines | 5.0080 | 5.0228 | 5.0476 | 5.0632 | 5.0637 | 5.0738 | 5.0839 |
| Change (%) | -1.09% | -0.80% | -0.31% | - | +0.01% | +0.21% | +0.41% |
| Change | -0.0552 | -0.0404 | -0.0156 | - | +0.0005 | +0.0106 | +0.0207 |
| Level | Intermediate | Major | Intermediate | - | Intermediate | Intermediate | Minor |
To determine price objectives, it is also possible to use the pivot points. Here is the price position in relation to pivot points:
| Pivot points | S3 | S2 | S1 | PP | R1 | R2 | R3 |
|---|---|---|---|---|---|---|---|
| Standard | 5.0231 | 5.0317 | 5.0482 | 5.0568 | 5.0733 | 5.0819 | 5.0984 |
| Camarilla | 5.0578 | 5.0601 | 5.0624 | 5.0647 | 5.0670 | 5.0693 | 5.0716 |
| Woodie | 5.0271 | 5.0337 | 5.0522 | 5.0588 | 5.0773 | 5.0839 | 5.1024 |
| Fibonacci | 5.0317 | 5.0413 | 5.0472 | 5.0568 | 5.0664 | 5.0723 | 5.0819 |
| Pivot points | S3 | S2 | S1 | PP | R1 | R2 | R3 |
|---|---|---|---|---|---|---|---|
| Standard | 4.9477 | 4.9833 | 5.0223 | 5.0579 | 5.0969 | 5.1325 | 5.1715 |
| Camarilla | 5.0407 | 5.0475 | 5.0544 | 5.0612 | 5.0680 | 5.0749 | 5.0817 |
| Woodie | 4.9493 | 4.9842 | 5.0239 | 5.0588 | 5.0985 | 5.1334 | 5.1731 |
| Fibonacci | 4.9833 | 5.0118 | 5.0294 | 5.0579 | 5.0864 | 5.1040 | 5.1325 |
| Pivot points | S3 | S2 | S1 | PP | R1 | R2 | R3 |
|---|---|---|---|---|---|---|---|
| Standard | 4.6876 | 4.8836 | 4.9983 | 5.1943 | 5.3090 | 5.5050 | 5.6197 |
| Camarilla | 5.0276 | 5.0560 | 5.0845 | 5.1130 | 5.1415 | 5.1700 | 5.1984 |
| Woodie | 4.6470 | 4.8633 | 4.9577 | 5.1740 | 5.2684 | 5.4847 | 5.5791 |
| Fibonacci | 4.8836 | 5.0023 | 5.0756 | 5.1943 | 5.3130 | 5.3863 | 5.5050 |
Numerical data
The following are the details of the technical indicators and moving averages that were collected to generate this technical analysis:
| RSI (14): | 48.04 | |
| MACD (12,26,9): | 0.0017 | |
| Directional Movement: | -3.0370 | |
| AROON (14): | -35.7142 | |
| DEMA (21): | 5.0673 | |
| Parabolic SAR (0,02-0,02-0,2): | 5.0762 | |
| Elder Ray (13): | -0.0035 | |
| Super Trend (3,10): | 5.0543 | |
| Zig ZAG (10): | 5.0595 | |
| VORTEX (21): | 1.0113 | |
| Stochastique (14,3,5): | 26.05 | |
| TEMA (21): | 5.0656 | |
| Williams %R (14): | -89.45 | |
| Chande Momentum Oscillator (20): | -0.0049 | |
| Repulse (5,40,3): | -0.0875 | |
| ROCnROLL: | -1 | |
| TRIX (15,9): | 0.0091 | |
| Courbe Coppock: | 0.12 |
| MA7: | 5.0541 | |
| MA20: | 5.0795 | |
| MA50: | 5.1702 | |
| MA100: | 5.1865 | |
| MAexp7: | 5.0641 | |
| MAexp20: | 5.0642 | |
| MAexp50: | 5.0597 | |
| MAexp100: | 5.0570 | |
| Price / MA7: | +0.18% | |
| Price / MA20: | -0.32% | |
| Price / MA50: | -2.07% | |
| Price / MA100: | -2.38% | |
| Price / MAexp7: | -0.02% | |
| Price / MAexp20: | -0.02% | |
| Price / MAexp50: | +0.07% | |
| Price / MAexp100: | +0.12% |
About author
Online


Add a comment
Comments
0 comments on the analysis AUD/HKD - 1H